|
New home sales fall 5.8%
|
 |
May 31, 2000: 1:47 p.m. ET
Rising rates prompt larger April drop than expected; leading indicators lower
|
NEW YORK (CNNfn) - New home sales fell 5.8 percent in April, more than twice the slide that had been expected, as higher mortgage rates put the brakes on home buying.
The Department of Commerce reported that sales fell to a seasonally adjusted annual sales rate of 909,000 in April, down from the revised 965,000 annual rate in March.
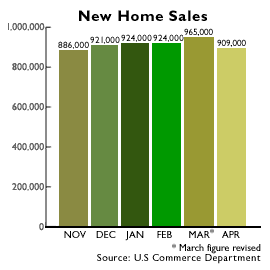 A survey by Briefing.com forecast that annual sales would fall to an annual rate of 940,000 in April. It's also below the 930,000 annual rate in April 1999. A survey by Briefing.com forecast that annual sales would fall to an annual rate of 940,000 in April. It's also below the 930,000 annual rate in April 1999.
Only the Northeast showed a slight rise in new home sales over March figures.
The sales report is a closely watched measure of economic activity because consumers usually buy appliances and other large ticket items in order to fill their new homes.
The drop in new home sales, the biggest since last September, comes as mortgage interest rates increase. The 30-year fixed rate mortgages were about 8.2 percent in April, and they've since risen above 8.6 percent, almost 1.5 percentage points higher than a year ago and near their highest levels since February 1995. So some believe the slowdown in the sector will get worse.
"There's other housing numbers showing some declines in April as well," David Seiders, chief economist for National Association of Home Builders, told CNNfn's In the Money program Wednesday. "My own survey of builders has shown them losing some momentum for the last couple of months, including May. I think there's some evidence accumulating that this supposedly highly interest-sensitive part of the economy is starting to give ground." (175KB WAV) (175KB AIFF)
But Seiders said the new home market is still strong compared with historic levels.
"We're off about 6 percent from March, but March was huge," he said. "It's still a very good number."
New home prices actually rose slightly in April. The median price was $161,400, compared with $160,000 a year earlier, although that preliminary price estimate slipped from a revised median of $165,000 in March. The average price rose to $208,000 from $202,300 in March and from $191,400 a year earlier.
Economic indicators also show slowing economy
Separately, the Conference Board reported that its index of leading economic indicators fell 0.1 percentage point to 106.0, as opposed to a forecast of a 0.1 percentage point rise for the period. The measure is designed to gauge economic activity six months in the future.
"The biggest risk to the ongoing expansion, which in June will be in its record 111th month, remains the interest-rate increases at hand and the prospect of still more action by the Federal Reserve Board," said a statement from Ken Goldstein, economist for the Conference Board. "The data suggest that some sectors may be beginning to respond to Fed tightening."
The government reported that one area of the economy that continues to show strong growth is online retail sales, which the Department of Commerce said increased in the first quarter from the fourth quarter, which included the holiday shopping period.
Online retail sales still make up only small sliver of overall retail sales, about 70 cents of every $100 spent by consumers on retail purchases. But Commerce estimated it grew 1.2 percent between the two periods to $5.26 billion from $5.20 billion in the fourth quarter.
By comparison, the end of the holiday season sent overall retail sales down 8.9 percent to $747.8 billion from $821.4 billion in the fourth quarter.
Some key segments of business-to-consumer e-commerce are not even included in the figures, since under Commerce statistics travel services, financial brokers and ticket sales agencies are not classified as retail and are not included in either the total retail or retail e-commerce sales estimates.
Markets cheered by reports of slowdown
The drops cheered bond and stock markets early Wednesday, as investors were hopeful that the sign of a slowing economy would lessen future interest rate hikes by the Federal Reserve.
The 30-year bond soared 1-2/32 points, sending its yield, which moves in the opposite direction, down to 6.02 percent from 6.09 percent late Tuesday. The 10-year note, now seen as a benchmark by many investors, rose 19/32 of a point, as its yield fell to 6.30 percent from 6.36 percent late Tuesday.
Both the Nasdaq composite index and the Dow Jones industrial average, which had been in negative territory early in the morning, turned higher shortly after the data announcements.
Wednesday's home sales report is one of the strongest signs yet of a change in consumer behavior due to higher interest rates.
Last month's new home sales showed a stronger-than-expected 4.5 percent increase in the face of higher interest rates. On Tuesday, a Conference Board measure of consumer confidence rose to 144.4 in May from a revised 137.7 in April, surpassing expectations of only a slight increase. 
|
|
|
|
|
 |

|