graphic
graphic  
graphic
News > Companies
graphic
Network Appliance tops 3Q
graphic February 12, 2002: 4:32 p.m. ET

Storage device maker sees profit, earnings fall but tops EPS forecast.
graphic
graphic graphic
graphic
graphic
graphic       graphic
  • Network Appliance results tumble -- Nov. 13, 2001
  • Network Appliance meets forecasts -- Aug. 14, 2001
  •  
    graphic
    graphic
    graphic       graphic
  • Network Appliance
  •  
    graphic
    NEW YORK (CNN/Money) - Network Appliance Inc. doubled Wall Street's earnings expectations for the data storage device company but still saw its profit, excluding special items, fall from year-earlier levels.

    The Sunnyvale, Calif.-based company earned $15.5 million, or 4 cents a share, excluding special items and amortization of goodwill, for the fiscal third quarter which ended Jan. 25. That's better than the earnings per share forecast of 2 cents by analysts surveyed by earnings tracker First Call, but down from the $38.9 million, or 11 cents a share, earned a year earlier.

    graphic  
    Including special items net income fell to $7.0 million, or 2 cents a share, compared with net income of $34.1 million, or 9 cents a share, a year earlier.

    Revenue at the company fell to $198.3 million, in line with forecasts but down from $288.4 million a year earlier.

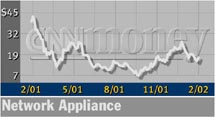
    Shares of Network Appliance (NTAP: Research, Estimates) gained 30 cents to $16.75 in after-hours trading following the earnings release, following a loss of 86 cents in regular-hours trading before the release. graphic

      RELATED STORIES

    Network Appliance results tumble -- Nov. 13, 2001

    Network Appliance meets forecasts -- Aug. 14, 2001

      RELATED LINKS

    Network Appliance


      graphic


    Most stock quote data provided by BATS. Market indices are shown in real time, except for the DJIA, which is delayed by two minutes. All times are ET. Disclaimer. Morningstar: © 2018 Morningstar, Inc. All Rights Reserved. Factset: FactSet Research Systems Inc. 2018. All rights reserved. Chicago Mercantile Association: Certain market data is the property of Chicago Mercantile Exchange Inc. and its licensors. All rights reserved. Dow Jones: The Dow Jones branded indices are proprietary to and are calculated, distributed and marketed by DJI Opco, a subsidiary of S&P Dow Jones Indices LLC and have been licensed for use to S&P Opco, LLC and CNN. Standard & Poor's and S&P are registered trademarks of Standard & Poor's Financial Services LLC and Dow Jones is a registered trademark of Dow Jones Trademark Holdings LLC. All content of the Dow Jones branded indices © S&P Dow Jones Indices LLC 2018 and/or its affiliates.

    Most stock quote data provided by BATS. Market indices are shown in real time, except for the DJIA, which is delayed by two minutes. All times are ET. Disclaimer. Morningstar: © 2018 Morningstar, Inc. All Rights Reserved. Factset: FactSet Research Systems Inc. 2018. All rights reserved. Chicago Mercantile Association: Certain market data is the property of Chicago Mercantile Exchange Inc. and its licensors. All rights reserved. Dow Jones: The Dow Jones branded indices are proprietary to and are calculated, distributed and marketed by DJI Opco, a subsidiary of S&P Dow Jones Indices LLC and have been licensed for use to S&P Opco, LLC and CNN. Standard & Poor's and S&P are registered trademarks of Standard & Poor's Financial Services LLC and Dow Jones is a registered trademark of Dow Jones Trademark Holdings LLC. All content of the Dow Jones branded indices © S&P Dow Jones Indices LLC 2018 and/or its affiliates.

    graphic