NEW YORK (CNN/Money) -
Though Tuesday's surge in U.S. consumer confidence would seem to forecast an imminent orgy of consumer spending, one economist's comparison of confidence indexes and spending data in the past 20 years indicates consumers don't always spend the way they feel.
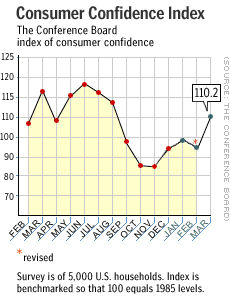
The Conference Board, the research group that compiles the Consumer Confidence Index, said March's unexpected jump in the index, to 110.2 from 95.0 in February, means consumers are going to spend more in coming months, fueling a quicker recovery from the economy's first recession in a decade.
But Deloitte Research chief economist Carl Steidtmann compared that index and the closely watched University of Michigan consumer sentiment index to consumer spending since 1982 and found that both indexes usually lagged or were completely misleading about spending behavior.

"Far from being a leading indicator of consumer spending, consumer confidence has consistently missed important changes in consumer spending trends," Steidtmann said.
Particularly striking was the contrast between consumer confidence and behavior in the wake of the Sept. 11 terror attacks. The Conference Board's index plunged in October 2001 to 85.5, its lowest level since February 1994, driven down by the impact of the attacks, hundreds of thousands of job cuts and a host of other economic woes. While the Michigan sentiment index recovered a bit in October, to 82.7 from an immediate post-Sept. 11 trough of 81.8, it was still well below its level in August 2001 of 91.5.
"So what did this deeply depressed consumer do? She went out spent like there was no tomorrow," Steidtmann said.
Retail sales in the United States rose 6.37 percent in October, the biggest gain since the Commerce Department started keeping track in 1992. For the entire fourth quarter, consumer spending rose 6.0 percent, the best performance since the second quarter of 1998.
Consumer spending makes up $6 trillion of the $9 trillion U.S. gross domestic product (GDP), and fourth-quarter spending pushed GDP into positive territory after a negative third quarter. In fact, though the National Bureau of Economic Research said a recession began in March 2001, it has been one of the mildest and shortest recessions in U.S. history, thanks largely to resilient consumer spending.
Motivated by politics
Confidence is often driven more by political developments than by economic conditions, Steidtmann found. He noted that fluctuations in confidence followed such events as the release of the U.S. hostages from Iran at the beginning of the Reagan administration, the Gulf War and the early stumbles of the Clinton presidency, but those shifts did not necessarily translate into corresponding changes in consumer behavior.
Even catastrophic economic events such as the 1987 stock-market crash and the Asian financial crisis in 1998, while detrimental to confidence in the short run, had no significant effect on spending, Steidtmann said.
| |
 Related links
| |
| | |
| | |
|
The confidence indexes, in fact, have tended to lag economic upturns and downturns, with consumers still registering unhappiness long after the recessions of the early 1980s and early 1990s were already over and still expressing confidence -- exuberance, in fact -- in the late 1980s and late 1990s, just before recessions began.
"At the end of a long economic expansion, consumers tend to be overconfident relative to their spending; raising false hopes about the ability of consumers to continue spending," Steidtmann said. "At the beginning of a recovery, consumers remain in a funk even as they accelerate their pace of spending."
"It is usually when consumer confidence hits all-time new lows that consumer spending is poised for a recovery," he added.

|

