NEW YORK (CNN/Money) -
New jobless claims edged up in the United States last week, the government said Thursday, pointing to more weakness in the labor market and reinforcing the notion that the Federal Reserve might leave interest rates lower for longer.
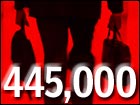
The number of Americans filing new claims for unemployment benefits rose to 445,000 last week from a revised 444,000 the prior week, the Labor Department reported. It was the third straight week that claims came in above 400,000, a level pointing to a sluggish job market. Economists surveyed by Briefing.com had expected 415,000 new claims.
Separately, the Conference Board, a private research firm, said its index of leading economic indicators edged up 0.1 percent in March to 112.3 after being unchanged in February. Analysts had expected the index, which is meant to predict the economy's direction in the coming months, to rise 0.3 percent.
The recent surge in jobless claims -- one of the leading indicators tracked by the Conference Board -- is partly a reflection of a number of workers re-filing for unemployment after Congress recently approved an extension of benefits. But the Labor Department has been unable to offer any guidance about what percentage of new claims are people applying for extended benefits, since many states don't make any distinction between new filers and re-filers.

"We had hoped the flow of people filing for extended benefits would slow this week, pushing claims back towards their underlying trend -- about 350,000, but it didn't happen," said Ian Shepherdson, chief U.S. economist at High Frequency Economics Ltd.
"At least, we think it didn't happen," he added. "There are no data to split out the refilers from the total, so we have no way to tell."
A more concrete sign of weakness was another jump in continued claims, the number of people who have been out of work for a week or more. That number rose to 3.84 million in the week ended April 6, the latest data available, from a revised 3.76 million the prior week. It was the highest since 3.88 million in the week of Feb. 26, 1983.
And the four-week moving average of new jobless claims, which smoothes out fluctuations in the weekly data, rose to 448,750 last week from a revised 435,000 the prior week. It was the highest four-week average since Nov. 10, 2001, when it was 453,750.
"Employment gains really haven't come from full-time workers. They're coming primarily from part-time, temporary help," said Sung Won Sohn, chief economist at Wells Fargo & Co. "Businesses are still trying to maintain flexibility by not hiring more expensive, full-time workers. That might be one of the reasons why we're seeing an increase in continued claims."
U.S. stock prices fell in in midday trading, while Treasury bond prices rose.
The data followed Wednesday's testimony by Alan Greenspan, in which the Federal Reserve chairman expressed cautious optimism about the economic recovery and signaled that the central bank might take its time in raising rates.
To keep consumers spending during that recession that most likely began in March 2001, the Fed cut its target for short-term interest rates 11 times last year. But the central bank held rates steady at its first two meetings this year, and New York Fed President William McDonough reiterated Thursday what Greenspan alluded to the day before, according to a Reuters report.
"When we think the economic recovery is much more clear and certain than it is now, we will have time to do what is necessary," McDonough told business leaders at Hofstra University Club, Reuters reported.
Though a recent spike in oil prices, driven by tensions in the Middle East and political turmoil in Venezuela has pushed consumer prices up a bit, most economists think inflation still is a distant threat, and weakness in the job market also could weigh on consumer spending and slow the recovery down. Employers have cut more than 1 million jobs since the downturn started last year.
| |
 Related links
| |
| | |
| | |
|
"Greenspan has to make sure the labor market has improved on a continuing basis before he can even think about hiking interest rates," Sohn said. "For example, in 1992, he waited 17 months after the peak of the unemployment rate before hiking interest rates."
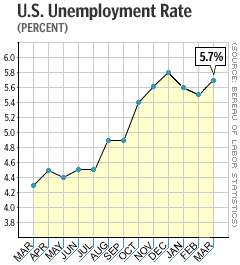
Though the unemployment rate peaked at 5.8 percent in December 2001 before falling in the first two months of 2002, it rose again in March to 5.7 percent, and many economists think it could go as high as 6 percent this year.
The weekly jobless claims number is one of the 10 components of the Conference Board's leading indicators, and it helped keep the index down, offsetting gains in average weekly manufacturing hours, stock prices, manufacturers' new orders for consumer goods and more.
The Conference Board's coincident index, which includes data about the current state of the economy, rose 0.2 percent after rising 0.2 percent in February. Its lagging index fell 0.4 percent after falling 0.5 percent in February.

|

