NEW YORK (CNN/Money) -
A closely watched gauge of future economic activity in the United States fell in April, a private research firm said Monday, the first drop since last September, reinforcing the notion that the economy's recovery from recession could be sluggish.
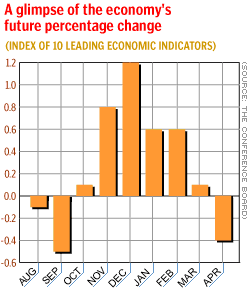
The Conference Board, a private research firm, said its index of leading economic indicators fell 0.4 percent in April to 111.7 after rising 0.1 percent in March. Analysts had expected the index, which is meant to predict the economy's direction in the coming months, to fall 0.2 percent.
"It's not really troubling. It's the first decline since September," said Gary Thayer, chief economist at A.G. Edwards & Sons. "Probably more important is the trend that's in place, which is upward. You would probably need to see three or more declines in the leading index to signal a problem."
During the past six months, the index has increased 2.2 percent, the Conference Board said.

"The overall signal from the leading index, however, remains one of moderate economic growth," the research group said.
On Wall Street, stocks retreated to their session lows after the news. Treasury bond prices posted strong gains.
The leading indicators that worsened in April were real money supply, stock prices, consumer expectations, average weekly initial claims for unemployment benefits, and interest rate spread.
Three indicators improved, including vendor performance -- the speed with which suppliers deliver goods -- building permits and manufacturers' new orders for non-defense capital goods. Average weekly manufacturing hours and manufacturers' new orders for consumer goods and materials were unchanged.
To keep consumers spending despite a recession that began in March 2001, the Federal Reserve cut its target for short-term interest rates 11 times in 2001. But it's kept rates unchanged so far this year and could continue to do so as long as the economy's recovery seems at risk.
"This economic indicator continues the string of statistical signs supporting the current Federal Reserve stance," said Sung Won Sohn, chief economist at Wells Fargo & Co. "The recovery seems to continue, but it is still too weak to generate sufficient payroll growth for inflationary pressure."
The Conference Board's coincident index, measuring current economic conditions, rose by 0.2 percent in April after gaining 0.1 percent in March. The lagging index, measuring past conditions, fell 0.4 percent after falling 0.9 percent in March.
"Modest gains in the coincident index in the past five months indicate a slowly recuperating economy," the Conference Board said.
| |
 Related links
| |
| | |
| | |
|
While most economists are convinced that the economy has begun to recover from its recession and isn't likely to fall into recession again, or "double-dip," there are still concerns that this recovery will look like the recovery from the 1990-91 recession, when unemployment kept rising for 15 grim months after the recession ended.
Such a performance in this recovery could hurt consumer confidence and threaten the strength of consumer spending, which fuels about two-thirds of the U.S. economy.
"I believe that such fears are overblown," Morgan Stanley economist Richard Berner said in a research note. "Advance labor-market indicators like Manpower's survey of businesses indicate that hiring plans are on the rise. So while it is true that job gains have been slow in coming, they typically are anemic in the early stages of recovery."

|

