NEW YORK (CNN/Money) - Service sector activity in the United States expanded again in May, the nation's purchasing managers said Wednesday, as the biggest industry in the world's biggest economy gained strength.
The Institute for Supply Management (ISM) said its index of non-manufacturing business activity rose to 60.1 in May from 55.3 in April. Economists surveyed by Briefing.com expected an index reading of 56.
It was the highest reading since August 2000. A reading above 50 indicates expansion in the sector; one below that points to contraction.
"We've been seeing improvement in the non-manufacturing side since late last year," said Gary Thayer, chief economist at A.G. Edwards. "We're seeing more activity in the travel sector and others that were hit really hard last year after the terror attacks."
U.S. stock prices added to earlier gains after the data, while Treasury bond prices fell.

The service industry is easily the largest component of the U.S. economy. Consumers spent about $3.7 trillion on services in the first quarter of 2002, making up 40 percent of the total $9.5 trillion gross domestic product (GDP).
And the service sector employs more Americans than any other industry -- about 107 million of the 131 million people on non-farm payrolls in April were in "service-producing" industries such as transportation, health care, restaurants and retail stores, according to the Labor Department.
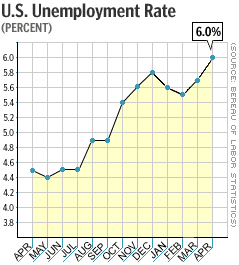
The Labor Department is scheduled to report the May unemployment rate on Friday. Economists surveyed by Briefing.com expect unemployment to rise to 6.1 percent from 6 percent in April.
And some have wondered if the recovery from a recession that began in March 2001 will be a "jobless" one, like the recovery following the 1990-91 recession, when unemployment rose for 15 months even as the broader economy recovered.
In Wednesday's ISM report, the Employment Index rose slightly to 49.5 from 48.9, a number indicating that jobs are still being cut in the sector, if at a slower pace. But the New Orders index also rose, to 56.8 from 56.4. Together with the headline index number, the ISM report could be a hopeful sign that employment will pick up soon.
| |
 Related links
| |
| | |
| | |
|
"I think we're close to a peak in the unemployment rate," Thayer said. "The upswings in manufacturing and non-manufacturing show we're close to it now."
On Monday, the ISM said its index of manufacturing activity rose to the highest level since February 2000, its fourth straight month of expansion following an 18-month-long recession.
Though it accounts for a smaller portion of the economy than services, strength in the manufacturing sector could be a sign that business spending is picking up. Federal Reserve Chairman Alan Greenspan has said business spending, which crumbled before the broader recession, is critical to the strength of the broader recovery.

|

