NEW YORK (CNN/Money) -
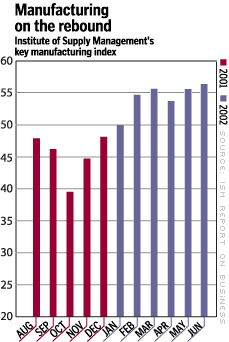
Manufacturing activity in the United States grew in June at a faster pace than in May, the nation's purchasing managers said Monday, the fifth straight month of expansion following a long recession in the industry.
The Institute for Supply Management (ISM) said its key gauge of manufacturing activity rose to 56.2 in June from 55.7 in May. Any reading over 50 indicates expansion, and economists surveyed by Briefing.com expected a reading of 55.5.
"June was a good month for manufacturing," ISM survey committee chairman Norbert Ore said in a statement. "The purchasing management index strengthened, as 15 industries saw improvement in production."
Separately, the Commerce Department reported that construction spending fell 0.7 percent to a $852 billion annual pace in May after rising a revised 0.4 percent in April. On average, economists expected construction spending to rise 0.2 percent, according to Briefing.com.

U.S. stock prices got a short-lived boost from the ISM report, but were mixed in morning trading. Treasury bond prices fell.
The ISM index was below 50 for 18 straight months between 2000 and 2001, as the industry fell into a prolonged slump following a boom in business spending at the end of the 1990s. When businesses stopped spending, production shut down and more than a million jobs were cut, triggering a recession in the broader economy.
For this reason, Federal Reserve Chairman Alan Greenspan and other economists believe that business spending will be key to the broader economy's recovery, and the ISM report raised some hope that spending is on the mend.
The ISM's production index jumped to 61.4 percent, the highest since June 1999, from 58.5 in May. Its new orders index rose to 63.1 from 60.8 in May. And its employment index rose to 49.7 from 47.3 in May, indicating that manufacturers have sharply slowed the pace of their job cuts.
"The manufacturing slump is over, and production has begun," said Wells Fargo chief economist Sung Won Sohn. "Production is important for creating jobs and boosting corporate profits, and this indicates that we will see better economic times ahead of us."
The ISM's prices-paid index jumped to 65.5 from 63 in May.
The decline in construction spending follows a huge jump earlier in the year, and the level of spending is still higher than it was at any point in 2001.
| |
 Related links
| |
| | |
| | |
|
Spending on new residential housing units was nearly flat at a $297 billion pace, while non-residential building construction fell 3.1 percent to a rate of $173 billion.
"Construction spending is always a lagging economic indicator, especially in commercial construction, because of the time it takes to plan, execute and build," Sohn said. "I expect housing to be a stabilizer, but commercial construction to be a drag on economic growth for a while to come."
The housing market has been boosted by relentlessly low mortgage rates, spurring demand for homes, driving prices higher and fueling a boom in refinancing that has encouraged consumer spending, which makes up two-thirds of the U.S. economy.

|

