NEW YORK (CNN/Money) -
Earnings warnings, bankruptcies, crooked CEOs. The worst September for stocks since the Great Depression. When might the pain finally end? Not until 2005, according to one school of thought.
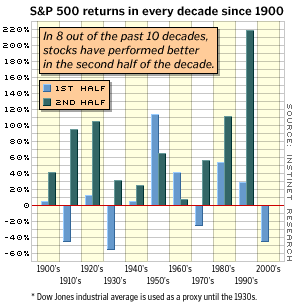
A new study by Instinet Research found that the S&P 500 almost always performs better in the second half of a decade than in the first half. In fact, the index earned an average of 76.7 percent in the last five years of most decades since 1900 -- compared with a flimsy 13.9 percent for the first five years.
The most lopsided ten-year stretch was the 1990s, when the S&P earned a whopping 219.9 percent from the start of 1995 through the end of 1999, but only 29.9 percent from 1990 through 1994. (See accompanying chart.) The only decades in which the first half produced better results were the 1950s and the 1960s.

In some decades, the first five years were deeply in the red -- the 1910s, 1930s and 1970s. This decade, too, has been negative so far. But the index has been positive in the last half of every decade since 1900.
What's more, stocks always hit the low for the decade during the first five years. The fastest arrival of the bottom was in the 1950s -- on Jan. 3, 1950. Investors waited the longest for the bottom in the 1910s -- on Dec. 24, 1914.
When might we see the bottom this time around? According to the survey, the average wait for the bottom is 2.2 years, putting the market on course for a bottom in February 2003.
Charting stock movement
Why has the second half of the decade proved to be so much stronger for stocks? If you look back at history, recessions and wars tend to start at the beginning of the decade, said Danny Seitz, a senior analyst at Instinet Research. There was World War II from 1941-45; the recessions of the early 1970s, 1980s and 1990s.
The Gulf War put a damper on stocks at the start of the 1990s. By the end of the decade, corporate earnings growth and a tidal wave of speculative investors helped fuel one of the most robust bull markets in history.
The stock market crash of 1929 was at the end of a decade, but most of the Great Depression was in the early 1930s. Then a robust bull market followed from 1933 through 1937, Seitz said.
Voodoo stock analysis?
But more than anything, the study might just be a reminder that bad markets always come to an end -- not a call to make investment decisions according to the calendar. After all, you can always find a theory to back up a decision to buy or sell stocks. There's the Super Bowl Indicator, which holds that a win by a member of the American Football League (before it merged with the National Football League) means a bad year for the markets. And in 1941, the market had a similarly whimsical indicator called "the hemline theory," which held that rising skirt lengths presage rising markets, and vice versa.
| Related stories:
|

|
|
|
|
It makes interesting dinner table conversation but purists say following such patterns makes for a dangerous investing game. Over the long-term, you're best served with a disciplined investing plan that ignores such factors as the year (and the Super Bowl).
"[The study] is food for thought, but I wouldn't change my portfolio based on it," said Jim Christie, a certified financial planner from Bridgewater, N.J. He stands by the strategy of dollar-cost averaging, in which you committ to buying a fixed dollar amount worth of stocks at pre-determined intervals. You'll buy fewer shares at high prices, and more at low prices, reducing your overall cost.
Nobody knows when the turnaround will really happen -- and you don't want to be out of the market when stocks shift direction.
"If you're sitting on the sidelines trying to figure out what's happening you will miss a window of opportunity," Christie said. "It goes back to the same old principal: If you're in the market for the long haul and use asset allocation you'll be ahead. Slow and steady investing wins the race."

|

