|
NAPM index declines
|
 |
January 3, 2000: 11:59 a.m. ET
Manufacturing output slips for third straight month; prices rise slightly
|
NEW YORK (CNNfn) - U.S. manufacturing activity eased for a third straight month in December while prices paid for materials used rose, a trade association report released Monday showed, indicating manufacturers aren’t churning out goods as rapidly as previously thought.
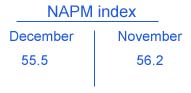
The National Association of Purchasing Management said its index of manufacturing activity slipped to 55.5 in December from 56.2 in November, the third monthly decline and below the 56.2 reading expected by analysts.
But the "prices paid" component -- a measure of costs -- rose to 65.7 from 65.3.
While the numbers still suggest robust manufacturing activity throughout the U.S., they did suggest that output is beginning to taper off -- a signal that the economy may be starting to slow from its robust pace. The U.S. economy expanded at a rapid 5.7 percent clip in the third quarter.
"If orders remain at this new level, production and employment will weaken over the next couple of months,” said Ian Shepherdson, chief U.S. economist with High Frequency Economics. "Overall, it’s a solid report, but manufacturing is not what the Federal Reserve is worrying about.”
Manufacturing still strong
Even with the decline, manufacturing activity still expanded for the 11th straight month in December. The overall index has been higher than 50 since January after declining in December 1998 to 45.3. That was the lowest since May 1991, at the end of the last recession.
A reading above 50 suggests accelerating manufacturing output, while below 50 indicates the opposite. The report is compiled by surveying purchasing managers at the nation’s factories and assembly plants.
Comments from purchasing managers included concern about soft demand for seasonal products caused by unusually warm weather, competition from imports in steel and textiles and continuing strength in the construction market, according to Norbert Ore, NAPM chairman.
"Overall, purchasing managers note continuing demand for many products as is possibly best described by one who sees business as ‘solid, but not hot,’” the report said.
Interest rate woes
Stocks reversed course and bonds extended already heavy losses as investors concluded the numbers -- particularly the prices paid component -- could further the case for higher interest rates from the Fed. The yield on the 30-year benchmark security rose as high as 5.58 percent before midday, its highest level in more than two years.
The Fed opted to hold the line on raising interest rates at its Dec. 21 meeting in order to avoid aggravating possible Y2K disruptions in financial markets. The current thinking on Wall Street is that Fed policy makers will vote to raise interest rates again at their Feb. 1-2 meeting to slow the economy and keep inflation in check.
The NAPM, an organization that provides information and resources for the purchasing profession, surveys some 350 of its 45,000 members each month to track economic activity in 20 industries across the U.S. Purchasing managers are the people who buy and sell the goods and services a company needs to make money.
NAPM also calculates indices based on levels of production, new orders, deliveries, inventories and employment among its members, offering different perspectives on the progress of the economy.
Production speeds up
Its production index, which measures the level of current output at the nation’s factories, rose to 58.7 in December from 57.4 in November. The new orders index, a gauge of current demand, fell to 55.5 from 59.9. The export index, a measure of international demand, slipped to 53.4 in December from 54.5 in November. The export index measures demand abroad for U.S.-made goods.
Its suppliers’ delivery index, which measures how much demand there is from clients to receive their goods, rose to 56.9 from 55.9, while the inventory index, another gauge of pent-up demand, fell to 47.2 from 50. The employment index, which measures companies’ hiring intentions as well as labor market conditions, rose to 54.3 from 52.2.
Financial markets follow the NAPM report closely because it offers a variety of different indicators that help them judge the pace of the economy. It is also the first report to be released each month, offering the first glimpse of how the economy is doing. 
|
|
|
|
|
 |

|