|
Top 401(k) funds off in '99
|
 |
January 13, 2000: 6:20 a.m. ET
New analysis shows biggest value funds in retirement plans lagged last year
By Staff Writer Martine Costello
|
NEW YORK (CNNfn) - Remember when your mother said that being popular isn't everything? If she was talking about mutual funds for your retirement plan, she was right.
New data shows that nearly one-third of the 99 largest funds in 401(k) plans earned less than 10 percent in 1999, a year marked by record bull market gains in technology and other sectors.
The analysis of the most popular retirement funds by Boston researcher Kanon Bloch Carre shows that virtually all of the losers were value-oriented funds -- those that invest in well-established but overlooked companies -- that remain out of favor on Wall Street. But all of the winners were funds that chase growth stocks.
"Value is in the dumps," said Bill Dougherty, an analyst at Kanon Bloch Carre. "It's not the managers. The problem last year was asset class performance. If you were a value manager, you didn't do well."

At the bottom of the list is Oakmark Fund, off 10.47 percent in 1999, followed by Vanguard Windsor II Fund, down 5.81 percent, according to the analysis. (Click here for a list of other losers).
By contrast, the S&P 500 gained 19.50% last year, and the Nasdaq composite index soared 85.95% percent.
Top performers include Putnam OTC Emerging Growth Fund, up 126.9%, and the Fidelity Aggressive Growth Fund, up 103.54%, according to the data. (Click here for a list of other winners).
Robert Sanborn, manager of the Oakmark Fund, isn't concerned about the returns last year. Growth stocks are soaring because investors keep throwing money at them, not because of sound business fundamentals, he said.
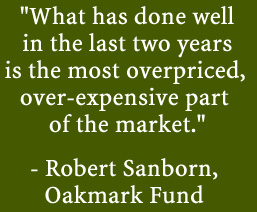
"People who are nervous about owning Oakmark Fund today will be nervous about owning all of these overvalued funds two years from now," Sanborn said. "What has done well in the last two years is the most overpriced, over-expensive part of the market. It's too overvalued, and it's going to collapse."
Wall Street sniffs at value
Value has been at the bottom of the performance charts for more than two years.
"A lot of investors don't know what this means," Dougherty said. "They say, 'Vanguard Windsor II is a good fund, why is it doing so poorly when Janus Twenty Fund is doing so well?'"
Funds that invest in value stocks earned 154 percent in the five years ending in 1997, compared with 148 percent for growth funds in the same time, Dougherty said. Value went into a steep decline in 1998 and since then has come out of its slump only once, early in 1999.

According to Chicago fund-tracker Morningstar, large-cap, mid-cap and small-cap value funds were the three worst stock fund performers in the fourth quarter of 1999. Only precious metals funds and bond funds fared worse.
Small-cap value earned 5.77 percent in the quarter, while mid-cap value earned 6.01 percent and large-cap value earned 6.38 percent, Morningstar said. By contrast, tech funds earned 61.96% percent and Japan stock funds gained 25.76% in the same time.
Rob Friedman, chief investment officer at the well-known Wall Street value shop Franklin Mutual Advisers, blamed a narrow market for the lackluster returns.
For example, the top 32 names of the S&P 500 are half the value of the index, Friedman said. The top five stocks in the Nasdaq are about one-third of the index, he said. Among the top tech names, Microsoft (MSFT) represents 11 percent of the Nasdaq, while Cisco (CSCO) represents 7 percent.
"The average stock was up 9 percent last year, whether it was growth or value," Friedman said. "The market is top-heavy to a select list of names."
But Friedman pointed out that his funds did better than their peers in 1999 by being more selective in their stock purchases. Mutual European Fund was up 47 percent in 1999; while Mutual Discovery Fund was up 27 percent; Mutual Beacon Fund rose 16.8 percent; Mutual Shares Fund gained 15 percent; and Mutual Qualified Fund earned 13.6 percent, he said.
"By value standards we had a good year," Friedman said.
What should investors do?
Peter DiTeresa, an analyst at Morningstar, said investors should realize that over time, value and growth will take turns leading the pack.
"The question is when are we going to see that cycle shift," DiTeresa said.
DiTeresa said one encouraging sign is that another dog of mutual fund performance charts, the small cap fund group, has come back to life. While the top returns have been mostly on the growth side, he's hoping to see it spread to value.
Friedman, of Franklin Mutual Advisers, said investors should think about risk as they look at the skewed returns of growth and value stocks.
"If you're comfortable with high risk, fine," Friedman said. "But if you're uncomfortable with risk, you can't do without value."
And Sanborn, of Oakmark Fund, said people should avoid throwing money at overpriced stocks. Sanborn, who is the largest shareholder of Oakmark Fund, predicted that two years from now it will be value that is soaring instead of growth.
"In the long run, stock market prices and values come together," Sanborn said. "Going forward, I love my fund and its values." 
|
|
|
|
|
 |

|

