|
New home sales slip
|
 |
March 29, 2000: 11:03 a.m. ET
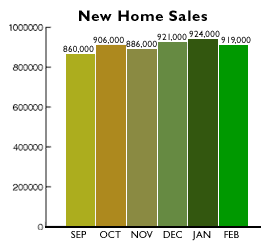
February sales drop 0.5% to 919,000 unit rate; January revised higher
|
NEW YORK (CNNfn) - Sales of new homes throughout the United States slowed in February, although January's rate was revised sharply higher, providing mixed signals about whether rising interest rates are having an effect on the white-hot housing market.
New home sales declined 0.5 percent to a seasonally adjusted annual rate of 919,000 units in February, the Commerce Department reported Wednesday, above analysts' estimates of 875,000 units. January's total was revised upward to a 0.3 percent increase to a 924,000-unit rate. It was initially reported as a 4.2 percent drop to an 882,000-unit pace.
 While the report suggested demand for new housing slowed last month, robust job growth, strong consumer optimism and the availability of cheaper, more flexible mortgage rates have kept the pace of new home sales high. What's more, a lack of supply in the new home market has driven people to existing homes, which posted a 6.7 percent jump last month. While the report suggested demand for new housing slowed last month, robust job growth, strong consumer optimism and the availability of cheaper, more flexible mortgage rates have kept the pace of new home sales high. What's more, a lack of supply in the new home market has driven people to existing homes, which posted a 6.7 percent jump last month.
"The labor market remains at historically tight levels, income growth continues at a solid pace, consumer confidence remains healthy and -- despite the recent volatility -- the stock market remains well supported," said Rob Palombi, a senior markets analyst with Standard & Poor's MMS. "Those factors suggest the U.S. housing market is not slowing all that much."
No stopping homebuyers
The Federal Reserve has raised short-term rates five times since last June, most recently on March 21 when it lifted its trend-setting fed funds rate a quarter point to 6 percent. Higher rates and concerns about inflation in recent months have pushed up bond yields, which are directly tied to mortgage rates.
Yet those rate increases haven't yet deterred potential home buyers. The average rate on a 30-year mortgage rose more than half a point between Dec. 10 and Feb. 18, when it reached a 3-1/2-year high of 8.38 percent, according to mortgage broker Freddie Mac. The rate on a 1-year adjustable mortgage climbed to 6.77 percent on Feb. 18.
 "Higher interest rates have been weathered by home buyers through the use of adept home financing techniques," said Steven Wood, an economist with Banc of America Securities in San Francisco. "Nevertheless, the resilience in the housing sector will support further monetary tightening by the Fed." "Higher interest rates have been weathered by home buyers through the use of adept home financing techniques," said Steven Wood, an economist with Banc of America Securities in San Francisco. "Nevertheless, the resilience in the housing sector will support further monetary tightening by the Fed."
Sales were mixed across the country. In the Midwest, they surged 15.6 percent last month, while sales in the West declined 10.2 percent. In the Northeast, sales gained 1.2 percent and, in the South, sales fell 0.2 percent. The median sales price of new houses sold was $162,000; the mean sales price was $202,500, the Commerce Department said.
At the end of February, the seasonally adjusted estimate of new houses for sale was 311,000, representing a supply of 4.1 months at the current sales pace. 
|
|
|
|
|
 |

|

