|
Funds find glass half full
|
 |
April 4, 2000: 7:19 p.m. ET
Amid market sell-off, managers were waiting, or selectively buying stocks
By Staff Writer Martine Costello
|
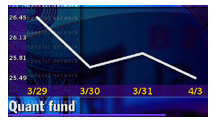
NEW YORK (CNNfn) - As the Nasdaq got slapped with massive volatility on Tuesday, fund manager Steven Esielonis spent the day building his "wish list" of stocks he's going to buy when the selling stops.
Esielonis, manager of the large-cap Quantitative Growth & Income Fund, said his tech-heavy fund took a hit as the Nasdaq plunged more than 13 percent before rebounding to close down 1.77 percent at 4,148.89.
"We're just sitting tight," Esielonis said.
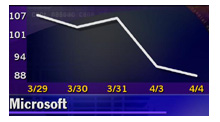
 The Nasdaq has hemorrhaged about 18 percent from its record high on March 10, putting it within bear market territory. And Microsoft, the most popular stock among U.S. mutual funds, has gotten hammered since a federal judge ruled the software giant violated antitrust laws. The stock fell 14 percent on Monday after the decision. The Nasdaq has hemorrhaged about 18 percent from its record high on March 10, putting it within bear market territory. And Microsoft, the most popular stock among U.S. mutual funds, has gotten hammered since a federal judge ruled the software giant violated antitrust laws. The stock fell 14 percent on Monday after the decision.
Microsoft (MSFT: Research, Estimates) represents 2.05 percent of the $3.17 trillion in domestic equity funds, or about $65 billion, according to Morningstar. Cisco Systems (CSCO: Research, Estimates), second on the list, accounts for 1.71 percent, or about $54.1 billion.
It's too soon to see what the fallout will be among mutual funds from Tuesday's volatility. Morningstar and the other fund trackers won't get data from Tuesday's sell-off until late Tuesday or Wednesday at the earliest. Most funds calculate their net asset value once a day, after the market closes.
"Obviously, people who are in tech sector funds are hurting at this moment," said Lou Harvey of fund researcher Dalbar Inc.
Technology funds are down an average of 17.95 percent for the week ending April 3, according to Morningstar. All domestic equity funds, which includes technology sector funds, are down 3.50 percent in the same time.�
 But Esielonis said one of the stocks he'll probably be buying is Microsoft. But Esielonis said one of the stocks he'll probably be buying is Microsoft.
"It's going to be a long, drawn-out process for Microsoft," Esielonis said.
Other managers, like Bill Fries, of Thornburg Funds, was buying beaten-down brokerage stocks like Merrill Lynch (MER: Research, Estimates). Thornburg Value Fund, with about $582 million in assets, is down 0.2 percent for the week ending April 3, Morningstar said. The fund is up 6.89 percent year to date as of April 3.
"Merrill Lynch was down about $20 at one point," Fries said. "I'm sitting here with my hard hat on, watching things fall...This is not a market where you can do anything except pick up a few stocks that you think are going to do all right long-term."
Fries, a value investor who has watched as the rest of Wall Street focuses on highflying technology stocks, said the volatility on Tuesday may help value stocks rebound.
"In the last year or so, investors have been oblivious to risk," Fries said.
Tom Goggins, manager of the John Hancock Financial Industries Fund, also welcomed the selling as a sign that investors will come back down to earth.
"I think you're going to have a more rational market where people are going to pay attention to earnings instead of buying stuff (like Internet stocks) that isn't going to making money for years," Goggins said.
Goggins said he spent the day buying brokerage and insurance stocks. His fund, whose sector has been battered recently, is up 6.08 percent year to date through April 3.
"A lot of people might be shocked when they see their 401(k) that was worth $2 million yesterday is only worth $1 million today," he said. "They might think twice about Internet stocks."
Esielonis, of the Quant fund, said he learned from a mentor about how to handle volatility during the stock market crash of 1987. Esielonis was a new money manager at the time.
"He was a wise person," Esielonis said. "He told me if the market acts like this the best thing to do is sit back and watch. So today, we're just watching what happens." 
|
|
|
|
|
 |

|