|
New home sales pick up
|
 |
May 2, 2000: 10:31 a.m. ET
March sales jump 4.5%, well above forecasts; leading indicators also rise
By Staff Writer M. Corey Goldman
|
NEW YORK (CNNfn) - Sales of new homes throughout the United States picked up steam in March, the government reported Tuesday, while a private report on leading economic indicators showed that the overall economy is still on track for growth heading into the second quarter.
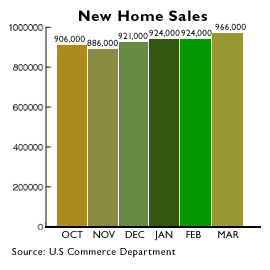
New home sales jumped 4.5 percent to a seasonally adjusted annual rate of 966,000 units in March, well above the 900,000-unit pace expected by analysts polled by Briefing.com and February's revised drop of 0.6 percent to 924,000 units, the Commerce Department said. February's figure was initially reported as a 0.5 percent decline to a 919,000-unit pace.
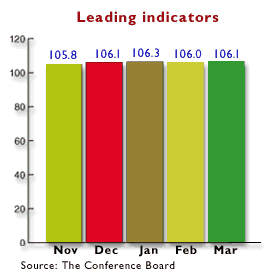
Separately, the Conference Board said its index of leading indicators gained 0.1 percent to 106.1 in March, the same pace as economists' forecasts and above the 0.3 percent drop registered a month before. It was the first gain for the index in five months, which aims to predict the U.S. economy's progress six to nine months ahead of time.
The reports indicate that the U.S. economy's rapid progress isn't necessarily ebbing, particularly in the white-hot housing market. While the Federal Reserve's series of interest rate increases have sparked higher borrowing costs for home buyers, many people are rushing to buy homes and lock in on mortgages before the Fed raises rates even further.
Lack of existing supply
What's more, a lack of supply of existing homes in many metropolitan markets is prompting home buyers to turn to the new housing market, driving up sales and the prices builders fetch for the houses, according to Ian Shepherdson, chief U.S. economist with High Frequency Economics.
"There is, in short, no sign that the housing market has turned down," Shepherdson said. "The lack of supply of existing homes simply means that prices will rise more quickly -- and with mortgage rates at just over 8 percent, there won't be any slowdown in home sales anytime soon."
 At the March pace, the inventory of homes available to buy was unchanged at 4.1 months in March. The number of new homes available for sale rose to 322,000 units from 310,000 in February. The median price of a new home -- the range between high and low -- rose to $165,000 from $160,000 a month earlier, while the mean, or average price of homes rose to $202,400 from $199,700 in February -- an indication that demand remains strong for luxury homes. At the March pace, the inventory of homes available to buy was unchanged at 4.1 months in March. The number of new homes available for sale rose to 322,000 units from 310,000 in February. The median price of a new home -- the range between high and low -- rose to $165,000 from $160,000 a month earlier, while the mean, or average price of homes rose to $202,400 from $199,700 in February -- an indication that demand remains strong for luxury homes.
The results "are great for builders, great for sellers of home building products and consumer household products, and great for growth," said David Orr, chief economist with First Union National Bank. "But, the dramatic strength in both units sold and in prices are both more fuel for a more aggressive Fed."
The housing market is normally a particularly interest-rate sensitive sector of the economy. But strong employment, high consumer confidence and soaring stock market and home equity gains have helped consumers buy homes, despite rates on 30-year mortgages of close to 8.5 percent. According to mortgage buyer Freddie Mac, mortgage rates have actually declined, falling to 8.13 percent last week after peaking at 8.38 percent in February.
A very strong showing
Indeed, March's sales gain was the strongest monthly showing for the U.S. housing market since November 1998 and marked the 27th consecutive month that sales were above the 800,000 annual rate mark -- the longest run since Commerce began keeping records on new home sales in 1963.
"Not only has housing held up in the face of five Fed tightenings since last June, it appears to be regaining strength," said Sherry Cooper, chief economist with brokerage BMO Nesbitt Burns Inc. "The Fed still has plenty of work to do." Fed officials meet May 16 to discuss the progress of the economy and monetary policy. A majority of economists expect the Fed to raise rates by a half point at that meeting to slow the economy's progress and head off inflation.
 In the West, sales rose by 12.9 percent to a pace of 272,000 units, in the Northeast sales gained 11.5 percent to 87,000 units, and in the Midwest sales ticked up 5.1 percent to 185,000 units. In the South, sales fell 1.9 percent to a pace of 421,000 units. In the West, sales rose by 12.9 percent to a pace of 272,000 units, in the Northeast sales gained 11.5 percent to 87,000 units, and in the Midwest sales ticked up 5.1 percent to 185,000 units. In the South, sales fell 1.9 percent to a pace of 421,000 units.
As for the Conference Board's report, also released Tuesday, five of the 10 factors that make up its index of leading indicators -- initial jobless claims, consumer goods orders, stock prices, money supply and spending on non-defense-related goods -- rose in March. The remaining five declined.
"The significant increase in the leading indicators during the last six months, tempered only by the financially related pause in February, points to forward momentum in this expansion," said Ken Goldstein, the agency's economist, adding that the momentum is likely to continue during the next few months. 
|
|
|
|
|
 |

|

