|
U.S. new home sales fall
|
 |
August 2, 2000: 10:18 a.m. ET
Drop is much steeper than expected, to lowest level since December 1997
|
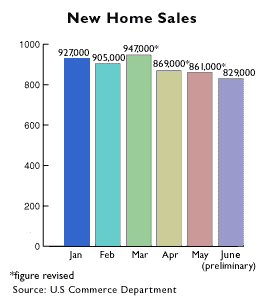
NEW YORK (CNNfn) - In another sign of the slowing U.S. economy, new home sales plunged 3.7 percent in June to their lowest level in more than two years.
The Commerce Department report said new home sales came in at an annual rate of 829,000, much lower than expectations. A survey of economists by Briefing.com forecast they would slip to an annual rate of 868,000 in June. The government revised the May figure down to an annual rate of 861,000.
The last time so few new homes were sold in a month was December 1997, when the annual rate was 793,000.
 New home sales help drive other economic activity because buyers often purchase appliances, furniture and other goods to fill their new homes. The purchase of both new and existing homes has become more expensive with the rise in mortgage interest rates over year-earlier levels. New home sales help drive other economic activity because buyers often purchase appliances, furniture and other goods to fill their new homes. The purchase of both new and existing homes has become more expensive with the rise in mortgage interest rates over year-earlier levels.
A measure of housing affordability -- which compares housing prices, interest rates and median income -- released by the National Association of Realtors Tuesday found homes at their least affordable levels in eight years. The government's housing price index rose to 134.2 in the second quarter, up 3.3 from the first quarter and well above the 127.0 level of a year earlier.
Stock markets cheer signs of slowdown
The report normally does little to move markets, but following Wednesday's report U.S. stocks rose. Investors have been cheered by other signs of a slowing economy in the belief that a slowdown means the Federal Reserve will not raise interest rates any further. Wednesday's housing report was given a fair amount of import by some economists.
"While the monthly data is often erratic and the government statisticians warn that it takes four months to establish a change in trend, it is pretty clear from the top chart that the explosion in housing from 1997 through early 2000 is ending," said David Orr, chief economist for First Union.
But the slowdown in new homes could merely be another sign of the Fed's desired "soft landing" for the economy rather than the start of a recession.
"The fact that the boom is ending should not be interpreted as indicating any serious trouble for builders or realtors -- unless, of course, some overextended on debt in expectations that sales would continue to accelerate," said Orr. "Prior to the recent explosion in sales, a level of 700,000 had been considered very strong. The current trend should be viewed as a return to normalcy rather than as the beginning of a housing recession."
New home sales edged up in the West during the month, according to the report released through the Census Bureau. But the other regions saw declines, with the biggest drop, 7 percent, coming in the Midwest.
Leading indicators also point to slowing economy
In a separate report, leading economic indicators -- an index compiled by the Conference Board, a business research group -- were roughly in line with forecasts. The group reported no change in its measures of various business statistics meant to predict future economic activity, compared with the 0.1 percent decline forecast for the period. The index had slipped 0.1 percent in May and was unchanged in April.
"The leading indicators are cooling off from the rapid pace registered at the end of last year," said Ken Goldstein, economist for the group. "This is not the kind of performance to be expected when gross domestic product grew by 5.2 percent, as it did in the second quarter of 2000."
The board also reported that the coincident index, which measures current business activity, rose 0.2 percent in June, following a similar rise in May.
"Gains in employment, income and industrial production continue to drive the coincident index ahead, even as the leading indicators point to a more modest pace of expansion," the group's report said. 
|
|
|
|
|
 |

|