|
GDP up; home sales down
|
 |
August 25, 2000: 11:28 a.m. ET
2Q GDP revised slightly up, but revision, homes sales flag slowdown
|
NEW YORK (CNNfn) - The U.S. economy grew slightly faster in the second quarter than initially thought, the government reported Friday, although signs of slowdown could be seen in both that report and a larger-than-expected drop in existing home sales in July.
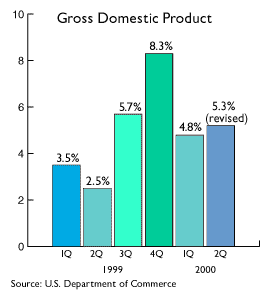
The Commerce Department report said gross domestic product grew at a 5.3 percent annual rate in the quarter, up from an initial estimate of a 5.2 percent gain in the total value of the nation's goods and service in its advance report July 28.
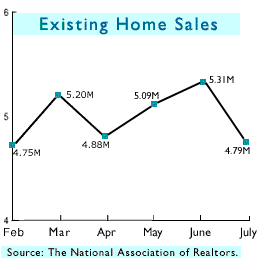
Meanwhile, the National Association of Realtors reported existing home sales hit an annual rate of 4.79 million in the month, down 9.8 percent from both the June figure and the July 1999 level. It attributed the decline to higher mortgage rates.
 That revision in the GDP was line with some economists' expectations, although analysts surveyed by Briefing.com had forecast GDP would be revised up to a 5.5 percent annual growth rate. That revision in the GDP was line with some economists' expectations, although analysts surveyed by Briefing.com had forecast GDP would be revised up to a 5.5 percent annual growth rate.
The GDP chain deflator, a measure of prices closely watched as an inflation indicator, showed a 2.6 percent increase. The Briefing.com survey forecast it to remain at the 2.5 percent level reported July 28.
When the advance report on GDP came out in July, it shocked many economists who were expecting a slowing in the period. The initial forecast at that point had been for only a 3.7 percent growth rate, a drop from the 4.8 percent rate posted in the first quarter.
Still, there are signs of a slowdown in the economy in the second-quarter report, despite the strong overall number. Most importantly, purchases by consumers, as measured by personal consumption expenditures, slowed to a 2.9 percent annual growth rate from a 7.6 percent rate in the first quarter.
Private businesses increased inventories $79.3 billion in the second quarter, which was responsible for much of the upward revision in the GDP. But rather than showing a strong economy, that could show that businesses produced more product than consumers were ready to buy in the period.
The buildup in inventories in the second quarter actually could lead some economists to lower their forecasts for third-quarter GDP growth, said Melanie Hardy, economist at Bear Stearns. She said the large inventory growth and the drop in domestic sales of finished goods are indications that the economy did slow in the quarter, even if factories kept turning out product based on the previous quarter's demands.
"If you have an inventory hangover in one quarter, it generally leads to downward revisions for the next quarter," she said. She expects to lower her estimate of third-quarter growth to 3.5 percent from 4.0 percent, based partly on Friday's report.
Still, despite indications of a slowing of the economy, the latest report suggests that the overall economic health of the nation is strong.
"Take lots of pictures, these are wonderful times," Glenn Migliozzi, managing director for fixed income at Fleet Investment Advisors, told Reuters, referring to strong growth and low inflation.
While the GDP is an important measure of the strength of the economy, it covers relatively old data in the eyes of many investors. Many other reports already available on July activity, such as Friday's home sales report, suggest a slowing in the economy in the third quarter.
Home sales fall much more than expected
The decline in existing home sales to an annual rate of 4.79 million single-family homes sold was much steeper than expected. The Briefing.com survey forecast that sales would only slip to an annual rate of 5.15 million sales in July from the revised 5.31 million sales rate in June.
 The inventory of existing homes on the market also showed signs of a slowdown from the very tight market earlier in the year. The report said there were 1.68 million existing homes available for sale, a 14.3 percent increase from the end of June, and a 78.7 percent rise from the������������������������� record low of only 940,000 homes on the market at the end of January. The inventory of existing homes on the market also showed signs of a slowdown from the very tight market earlier in the year. The report said there were 1.68 million existing homes available for sale, a 14.3 percent increase from the end of June, and a 78.7 percent rise from the������������������������� record low of only 940,000 homes on the market at the end of January.
The trade group said that the higher mortgage rates hit in May caused July's slowdown in sales.
"In May, mortgage interest rates hit their highest level in more than five years, slowing the number of transactions closed in July," said Dennis Cronk, president of the group. "There's always a lag effect when interest rates rise, and we typically don't see the impact for a month or so -- given the amount of time between a typical contract negotiation and a transaction closing."
Still, mortgage rates have dropped slightly since the May peak, falling to 8.15 percent in July from 8.29 percent in June and the 8.52 percent peak hit in May. That could bring about a rebound in sales later this year, according to David Lereah, NAR's chief economist.
"Mortgage interest rates have been declining recently, and we shouldn't be surprised to see the 30-year fixed rate approaching 7.75 percent by the end of the year," he said. "This could help keep first-time buyers in the housing market and boost home sales in the months ahead."
Even with a drop in sales and more houses on the market, housing prices continued to rise in July, according to the group's report. The median price of the home still increased to $143,300 from $140,200 in June, an increase of 5.4 percent from the $136,000 median price of a year earlier.
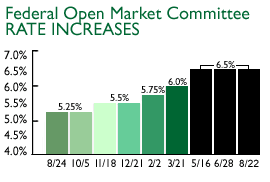 The economic reports are closely watched for clues as to what the Federal Reserve is likely to do with short-term interest rates. At its meeting Tuesday, the Fed left rates unchanged for the second straight meeting -- and some economists believe the central bank now is at or near the end of its series of six interest rate increases since June 1999. The economic reports are closely watched for clues as to what the Federal Reserve is likely to do with short-term interest rates. At its meeting Tuesday, the Fed left rates unchanged for the second straight meeting -- and some economists believe the central bank now is at or near the end of its series of six interest rate increases since June 1999.
U.S. stock markets opened slightly higher Friday, while bonds were little changed. 
|
|
|
|
|
 |

|