|
Trade gap hits record
|
 |
September 20, 2000: 8:43 a.m. ET
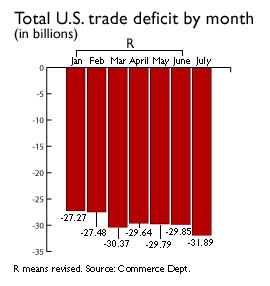
High oil prices and strong dollar push July deficit to $31.9B
|
NEW YORK (CNNfn) - The U.S. trade deficit hit another record in July, the government reported Wednesday, as high oil prices and a strong dollar drove the gap a bit wider than forecasts to nearly $31.9 billion.
The strong value of the dollar compared with the currencies of major trading partners increased the price of U.S. goods overseas and made imports more attractive to U.S. buyers. Exports of U.S. goods fell to $89.7 billion in July from $91 billion in June. Exports had risen in five of the previous six months this year, despite increasing trade deficits.
 Imports rose to $121.6 billion from $120.8 billion, with much of the rise due to higher spending on energy. The average price of imported oil rose to $27.76 a barrel in July, the highest since November 1990 and up from $26.65 in June and only $16.11 a year earlier. The volume of petroleum and crude imports slipped to 373.5 million barrels from 379.4 million barrels in June, but the higher prices increased the value of imports to $10.52 billion. Imports rose to $121.6 billion from $120.8 billion, with much of the rise due to higher spending on energy. The average price of imported oil rose to $27.76 a barrel in July, the highest since November 1990 and up from $26.65 in June and only $16.11 a year earlier. The volume of petroleum and crude imports slipped to 373.5 million barrels from 379.4 million barrels in June, but the higher prices increased the value of imports to $10.52 billion.
That part of the trade problem is only likely to get worse in future reports, as prices have continued to rise. New York crude oil futures for October delivery shot up to a new 10-year high Wednesday of $37.16 a barrel, up 67 cents.
"Exports are off in virtually every category," Mark Vitner, economist for First Union, told Reuters Wednesday. "I don't see much near-term improvement for the trade deficit. The trade deficit will probably shave about 0.5 percent off of third quarter Gross Domestic Product."
Economists forecast that the deficit would rise to $31.0 billion in July, according to Briefing.com, which tracks estimates. The latest gap topped the previous record of $30.4 billion set in March, as well as the revised $29.8 billion figure in June.
"We're starting to get into the zone where if this persists its problematic," Peter Morici, senior fellow at the Economic Strategy Institute, told CNNfn's Before Hours program. "We're getting close to 5 percent of GDP. That's really too much." (513KB WAV) (513KB AIFF)
But it wasn't just oil imports that drove the deficit. Record deficits with western Europe, Japan, China and Canada, the biggest U.S. trading partner, all contributed, the Commerce Department said in its report. The deficit with Europe, whose common currency, the euro, has lost value against the dollar, jumped to $7.2 billion from $4.3 billion in June.
The deficit with China widened to $7.6 billion, the largest gap with any trading partner, from $7.2 billion in June. The report came the day after the U.S. Congress approved normalizing trade ties with China.
Proponents of the China trade bill argue it could double U.S. exports to the world's most populous nation within five years, helping to close the current gap. U.S. exports to China rose $300 million to $1.6 billion, while imports from China rose $700 million to $9.3 billion.
"We don't give them any more market access," said Morici about the trade bill. "They won't have any more sales here, but we should have more sales there. But that deal by itself will not resolve this problem."
Major U.S. stock indexes were lower in early trading. This report covers a relatively old period of July. But the continued rising price of oil and the weakening euro mean some of the factors in this report still are very much at play in the market. 
|
|
|
|
|
 |

|