|
Treasurys stage comeback
|
 |
March 28, 2001: 9:18 a.m. ET
Government debt prices rise as warnings sink stocks; dollar mixed
|
NEW YORK (CNNfn) - U.S. Treasury bond prices recovered from three days of losses in early trading Wednesday as corporate warnings sent U.S. stock futures tumbling.
 Shortly after 9:00 a.m. ET, two-year Treasury notes were up 3/32 at 100-15/32, as their yield, which moves inversely to price, fell to 4.37 percent. Five-year notes rose 5/32 to 104-16/32 to yield 4.66 percent. Shortly after 9:00 a.m. ET, two-year Treasury notes were up 3/32 at 100-15/32, as their yield, which moves inversely to price, fell to 4.37 percent. Five-year notes rose 5/32 to 104-16/32 to yield 4.66 percent.
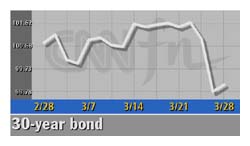
Benchmark 10-year notes gained 10/32 to 100-7/32, yielding 4.97 percent, while 30-year bonds rose 11/32 to 99-3/32 to yield 5.44 percent.
Bonds to follow stocks
Warnings about corporate results from Palm Inc. (PALM: Research, Estimates) and Nortel Networks Corp. (NT: Research, Estimates) hurt stock futures and threatened to end an extended rally by U.S. stocks, �sending traders back to the relative safety of government debt.
With no economic data due, analysts said Treasurys would take their cues from the stock market Wednesday.
"It's going to be another stock/bond trade day," said Carey Leahey, senior U.S. economist at Deutsche Bank Securities.
Treasurys suffered a brutal selloff Tuesday after the Conference Board said consumer confidence registered a surprising gain in March, killing hopes for an aggressive interest-rate cut from the Federal Reserve.
 The sell-off led to a yield near 5 percent on the benchmark 10-year Treasury note, encouraging some bottom-fishing in the U.S. market, Leahey said. The sell-off led to a yield near 5 percent on the benchmark 10-year Treasury note, encouraging some bottom-fishing in the U.S. market, Leahey said.
"We haven't had a 5-percent handle on 10-year in some time, and people are jumping on that," he said.
Dollar mixed
The dollar continued to give up recent gains against the Japanese yen, but gained against the euro.
The dollar bought 121.77 yen by late afternoon in Tokyo, below its late New York level of 122.15 yen.
Meanwhile, the euro was quoted at 88.74 cents, down from 89.80 cents late Tuesday. 
- from staff and wire reports
|
|
|
|
|
 |

|