NEW YORK (CNN/Money) -
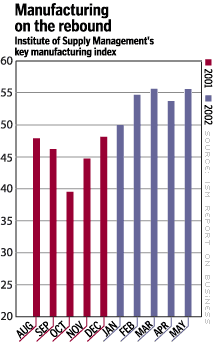
Manufacturing activity in the United States grew in May at a faster pace than in April, the nation's purchasing managers said Monday, the fourth straight month of expansion and a sign that the broader economy is recovering from its first recession in a decade.
The Institute for Supply Management (ISM) said its key gauge of manufacturing activity rose to 55.7 in May from 53.9 in April. Any reading over 50 indicates expansion, and economists surveyed by Briefing.com expected a reading of 55.
It was the highest index reading since 56.7 in February 2000, the ISM said.
"May was a good month for manufacturing," said Norbert Ore, ISM survey committee chairman. "Sixteen industries saw improvement in new orders. This should help establish momentum in the sector that will carry forward into the third quarter."

Separately, the Commerce Department reported that construction spending rose 0.2 percent in April to a $871.9 billion annualized rate after dropping a revised 1.2 percent in March. Economists surveyed by Briefing.com expected construction spending to fall 0.1 percent.
Private residential construction rose 0.7 percent to a $425.5 billion annualized rate, the highest on record.
Choosing to focus on negatives such as tensions between nuclear powers India and Pakistan, continuing terror threats and uncertainty about corporate reliability, investors sent U.S. stock prices lower. Treasury bond prices initially fell before recovering in afternoon trade to finish nearly flat.
"While the U.S. economy is still transitioning, and will for some time, data that should be supporting confidence in the recovery have not worked to ease investor concerns," Salomon Smith Barney senior economist Steven Wieting said. "We have to wonder if markets won't derail an otherwise quite healthy recovery in much of the core of the U.S. economy."
The manufacturing sector was hardest hit by a prolonged slowdown in spending by businesses following a spending bubble in the late 1990s. More than a million jobs were cut in the sector during an 18-month recession that eventually led to a broader decline in the overall economy.
To keep consumers spending during the downturn, the Federal Reserve cut its target for short-term interest rates 11 times in 2001. The strategy worked, and consumers kept spending, making the recession one of the mildest in history.
But the strength of the recovery - and the eventual recovery of the still-weakening labor market - will depend on a pickup in business spending, according to Fed Chairman Alan Greenspan and other economists.
| |
 Related links
| |
| | |
| | |
|
The ISM report had a number of promising signs possibly pointing to increased business spending and hiring. The ISM's New Orders Index rose to 63.1 in May from 59 percent in April. Its Employment Index rose to 47.3 from 46.7 in April. An employment index below 50 indicates that jobs are still being cut, but at a slower pace.
"Manufacturing could be a key driver of economic growth in the future, as opposed to being a big drag as we've seen in the past," said Sung Won Sohn, chief economist at Wells Fargo & Co. "Even employment, which has been weak, should be coming around as demand continues to pick up steam."
According to Briefing.com, the Labor Department is expected to report Friday that the nation's unemployment rate rose to 6.1 percent in May from 6 percent in April.

|

