NEW YORK (CNN/Money) -
American Airlines' parent company saw its second-quarter loss soar and although the world's largest airline company was able to land results slightly better than Wall Street expectations, it warned it will post another big loss in the current quarter.
Dallas-based AMR Corp. lost $465 million, or $3.00 a share, excluding special items. Analysts surveyed by earnings tracker First Call had a consensus forecast of a loss of $3.04 a share, up from $105 million, or 68 cents a share, it lost a year earlier.
Including special items, the net loss was $495 million, or $3.19 a share, slightly narrower than the net loss of $507 million, or $3.29 a share, a year earlier.
Chief Financial Officer Jeff Campbell did not give specific earnings guidance for the third quarter or full year, although he warned that the company would "likely report a sizable loss in the third quarter," although he said he still hopes it will be an improvement from the second-quarter.
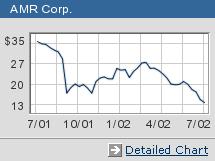
Shares of AMR (AMR: down $0.29 to $12.98, Research, Estimates) fell about 3 percent in late afternoon trading Wednesday.
First Call's third-quarter consensus forecasts a loss of $1.58 a share, with estimates ranging from 75 cents to $2.40 a share. The company lost $3.40 a share in the year-ago third quarter, excluding special items, in the period that included the terrorist attack.
Revenue in the second quarter fell 19.8 percent to $4.48 billion from $5.58 billion a year ago, which put it just below the First Call forecast of $4.61 billion, as the airline was hit by continued weakness in fares and full-priced business travelers. Campbell admitted that demand for travel did not rebound as much as expected at the beginning of the period.
Miles flown by paying passengers fell 10.8 percent to 31.4 billion. But schedule cuts in the wake of the Sept. 11 terrorist attack left planes roughly as full as a year ago, and the airline operated at 71.4 percent of capacity compared with 71.6 percent a year earlier.
What hit the carrier was a 9.5 percent drop in the average paid by passengers for every mile traveled, a measure of air fares. Passengers paid an average of 11.94 cents for every mile flown, down from 13.2 cents. Domestic fares are off more than overseas fares, and the full-fare business travelers, a key to profitability, is still very weak.
| |
 Related stories
| |
| | |
| | |
|
"Key business markets remain very weak, while leisure markets such as Hawaii have held up much better," Campbell said. He said American would adjust its schedule to shift more assets toward leisure travel.
Costs came in slightly better than expected at the beginning of the quarter, Campbell said, pointing to unit costs, which measure how much it costs to fly each available seat one mile. He expected unit costs to continue to be cut in the third quarter.
Click here for a look at airline stocks
Campbell said lower fuel prices helped unit cost comparisons in the second quarter, though comparisons to year-ago fuel prices will be more difficult in the third quarter. The airline also was helped by grounding less fuel efficient aircraft and other steps that helped improve fuel economy. The industry trend of halting most commissions to domestic travel agents also cut costs. But security measures and insurance raised costs by about $70 million.

|