For the first time in four years, the number of Americans without health insurance decreased.
The U.S. Census Bureau reported Wednesday that 48.6 million people were uninsured in 2011 -- down from 50 million the year before.
The percentage of uninsured people also ticked lower, edging down to 15.7% from 16.3%.
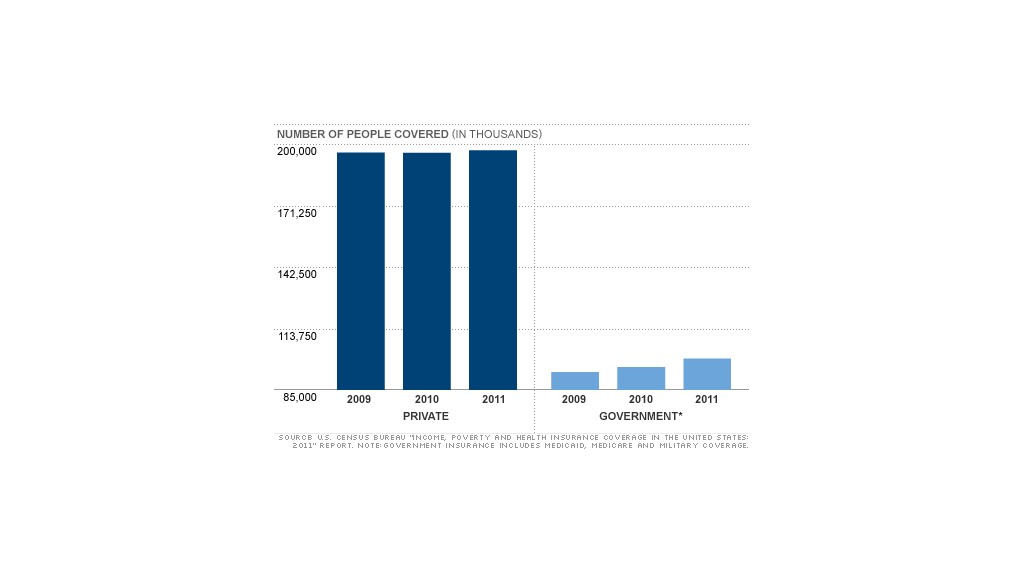
However, for the fifth consecutive year, the percentage of people covered by government health insurance increased -- up to 32.2% from 31.2% in 2010.
People covered by Medicaid increased to 16.5% from 15.8%, and Medicare coverage edged higher to 15.2% from 14.6%.
At the same time, more young adults gained coverage from a provision of the Affordable Care Act that allows parents to keep their children on their policies. That piece of health care reform went into effect in September 2010.
The percentage of young adults ages 19 to 25 who were uninsured decreased in 2011 to 27.7% from 29.8%.
For adults between 26 and 64 years old -- for whom the major parts of ACA coverage expansion won't go into effect until 2014 -- the uninsured rate remained relatively flat, the Census Bureau found.
Related: Romney-Ryan would aim to overhaul Medicaid
While the number of people relying on government insurance programs was higher last year, the report shows that the percentage of people covered by private health insurance in 2011 remained about the same, at 63.9%.
Considering that private coverage remains flat and the number of young adults receiving this coverage is increasing, experts say that another age demographic must be taking a hit.

"The young adults clearly have been quite a bit better off because of the ACA and by picking up more public coverage, but if they're better off, someone else is probably worse off," said John Holahan, director of the health policy center at the Urban Institute. "And it seems like here, it's the 55 to 64 [year olds] who are losing private but picking up public coverage."
The rate of private health coverage ticked higher for all age groups between 18 and 54, but for those in the 55- to 64-year old bracket, the rate edged slightly lower.
Related: Median income falls, but so does poverty
This also is the same age demographic who saw the largest decline in median household income. While overall household income among all age groups declined 1.5% in 2011, 55- to 64-year olds saw a much more significant 4% drop.
"The decrease for 55- to 64-year olds is a lot for one year," said Holahan. "It may be that it's older workers who have lost their jobs and private coverage, who then wait a few years until they're Medicaid-eligible at 65."


