The party on Wall Street may not be over yet, but some of the guests are starting to sober up.
Stock prices have reached levels that experts believe could set the stage for lackluster returns over the next few years.
Say hello to the era of diminished returns. That doesn't necessarily mean negative performance, but even getting 6% to 8% a year could be a stretch.
The Shiller price to earnings ratio was designed by Nobel Prize winning economist Robert Shiller to give investors a sense of whether stocks are cheap or expensive. It compares stock prices, as measured by the S&P 500 index, with inflation-adjusted corporate earnings over the past 10 years.
The magic number at the moment is 25. That's the current Shiller ratio, and it indicates that stocks are on the expensive side. The long-term average, going back more than 130 years, is 16.5.
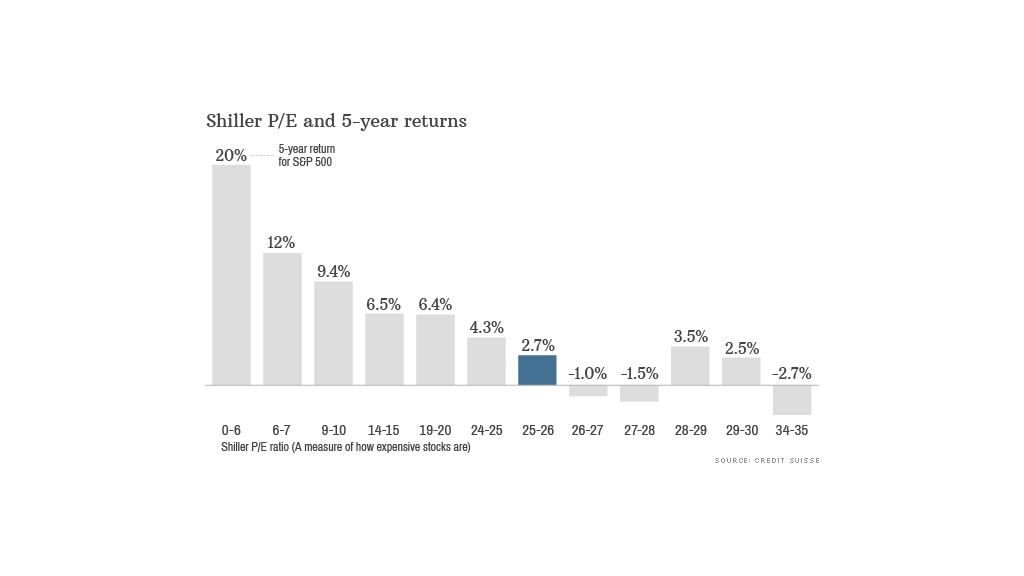
But the current level is significant for another reason. According to research by Credit Suisse, when the ratio has been between 25 and 26 in the past, stock returns over the next five years have been just 2.7%. That's after adjusting for inflation.
Once it rises above 26, five-year returns have been slightly negative.
Of course, when it comes to the stock market, nothing is easy to predict.
While high valuations typically mean lower returns, the stock market has produced some anomalies. For example, when the ratio is between 28 and 31, five year returns have been between 2.5% and 3.5%, according to Credit Suisse.
To add to the head scratching, the forward price-to-earnings ratio, which compares stock prices with expected earnings one year in the future, currently stands at 15 for the S&P 500, according to FactSet. That's not so far off the average.
Related: Stock market bubble talk may be inflated
If history is any guide...
Still, it seems safe to say that stock returns over the next few years will not be as robust as they were over the past few years.
The more expensive stocks become, the less upside there is in terms of price appreciation, and therefore overall returns are likely to decrease.
The S&P 500 has more than doubled in price over the past five years, raising concerns that stocks are overvalued.
The Shiller ratio has been this high only a few times in history, and in each case the stock market was in the midst of a speculative bubble.
It rose above 25 for the first time in 1901, then again in 1929. At the height of the tech stock craze in 2000, the ratio hit a record peak of 44 before the market collapsed. It was back above 25 in 2003 and stayed around that level until 2007 -- shortly before the so-called Great Recession.
The Beanie Baby market
Does this mean stocks headed for another crash?

Shiller, who is famous for calling the technology and housing bubbles, says predicting what stocks will do in the short run is difficult, if not impossible, to do with certainty. But he says making long term forecasts, over 10 years or more, is much easier.
Related: 3 tech stocks worth buying now
"The opposite of the case with weather forecasting," Shiller told CNNMoney recently.
That's based largely on human psychology. Shiller said research in behavioral finance suggests that investors, like everyone else, are susceptible to "fashions and fads."
Beanie Babies are a prime example of what Shiller calls "social epidemics."
At the height of the Beanie Baby craze in 1995, collectors paid tens of thousands of dollars for plush toys stuffed with plastic pellets. This turned out to be a bad long term investment. Beanie Babies are now essentially worthless.
Of course, stocks and Beanie Babies are very different animals. But the point is that investors can get caught up in asset bubbles without realizing it until years later.
"These fads are hard to predict," said Shiller. "But you can bet that they will be gone in a decade."


