Dow 20,000 is a milestone more than 120 years in the making.
The average began tracking the most powerful corporate stocks in 1896, and has served as a broad measure of the market's health through 22 presidents, 22 recessions, a Great Depression, at least two crashes and innumerable rallies, corrections, bull and bear markets. The blue chip reading finally cracked the 20,000 benchmark for the first time early Wednesday.
During the current bull market, the second longest in history, the Dow has more than tripled since March 2009.
Related: Boom - Dow hits 20,000 for the first time
The index is based on the price of 30 stocks, the composition of which is tweaked occasionally to adjust for changes in the economy and the companies themselves. Today's Dow includes technology and healthcare stocks, for example. Past staples like steel and tobacco are no longer represented.
Related: Biggest threats to the Trump market rally
Here are some mileposts along the Dow's road to 20,000:
Dow is formed: The first daily close, on May 26, 1896, was 40.94. The Dow did not start well, plunging 30% to an all-time low of 28.48 by August that year.
Dow 100: The Dow first closed in triple digits on Jan. 1906. That marked an impressive rally for the average, which had hit an all-time low when Teddy Roosevelt was president. The Federal Reserve would not be created for seven more years.
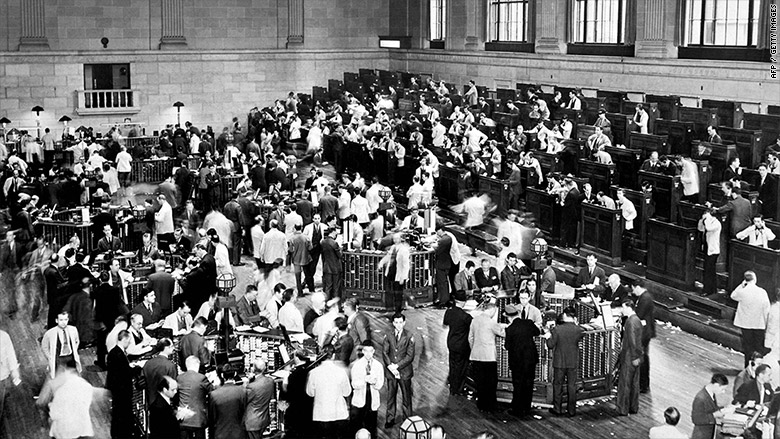
Crash of 1929: The Dow fell 38 points on Oct. 28 and 31 more points the next day. That might not sound bad today, but it represented back-to-back declines of 13% and 12% of the Dow's value. Those are still two of the worst one-day percentage declines in the index's history.
Dow 1,000: Nov. 14, 1972. Richard Nixon had just won re-election by taking 49 states. The Dow's components, which had been unchanged for 13 years, included Woolworth, Eastman Kodak and International Nickel.
Crash of 1987: On Oct. 19, the Dow plunged 508 points, a 23% drop, still the largest one-day percentage decline in history. A week later it took an 8% plunge. But the damage was short-lived: Within a year, the Dow was back to pre-crash levels.

Dow 10,000: March 29, 1999. The "irrational exuberance" of the tech bubble was in full gear as the Dow gained 1,000 points in less than a year to hit this benchmark. It gained 1,000 more points in just the next month. A year later, the tech bubble burst, sending the Dow down nearly 30% by September 2001.
Related: Today's Dow is a lot different from just 20 years ago
Meltdown of 2008-2009: The financial crisis caused the Dow to lose about half its value in less than a year, bottoming at a closing low of 6,547 on March 9, 2009. The worst day was Sept. 29, 2008, when the Dow lost a record 778 points after Congress rejecting a $700 billion bank bailout. The bailout was later approved.
Dow 15,000: May 7, 2013. During one of its strongest periods of the current bull market, it took the Dow only two months to climb from 14,000 to 15,000. The jump from 19,000 to 20,000 also took about two months.

