The stock market's record-breaking ascent this year has become a favorite topic for President Donald Trump.
"With the great vote on Cutting Taxes, this could be a big day for the Stock Market - and YOU!" he tweeted on Monday morning.
It's true -- the S&P 500 is up 17.4% since the beginning of the year and the Dow Jones Industrial Average is up 22.2%, reflecting strong corporate earnings and the anticipation of a massive tax cut.
But just who benefits from those skyrocketing numbers?
The short answer: Wealthy people.
As measured by those who declare ordinary dividend income on their tax returns, stock ownership varies dramatically by income level. Among filers who make less than $25,000 a year, only about 8% own stocks. Meanwhile, 88% of those making more than $1 million are in the market, which explains why the rising stock market tracks with increasing levels of inequality.
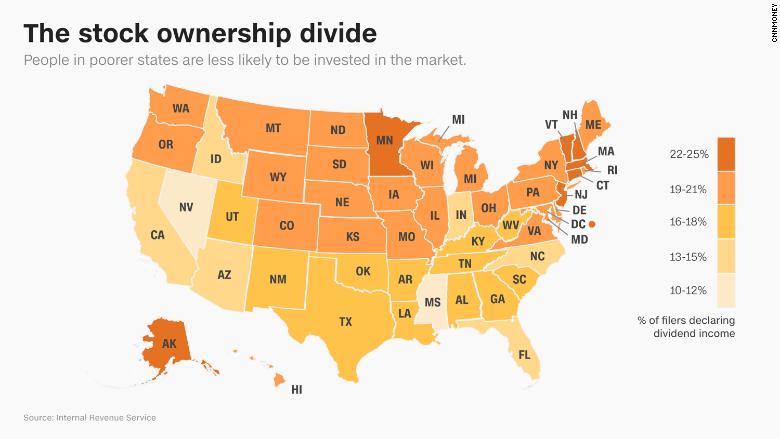
On average across the United States, only 18.7% of taxpayers directly own stocks. Now, these numbers only include stock portfolios, not the roughly half of Americans who participate in the market through an employer-sponsored retirement plan, according to a Pew analysis of Census Bureau data. Access to those plans also skews towards higher income people, Pew found. In addition, more white people invested this way than black or Latino people, as did more older people than younger people.
Accordingly, the states with the wealthiest populations also tend to have higher rates of stock ownership. In Connecticut and Massachusetts, where median incomes are among the highest in the country, about one in four tax filers own stocks. Mississippi, meanwhile, has the lowest rate, at only 10%, with Nevada, Alabama, and Tennessee following close behind.

But there's a deeper answer, too.
As highlighted recently in an analysis by the Federal Reserve Bank of St. Louis, stock ownership also varies among people who make similar amounts of money.
Here's what a host of studies tell us: Stock ownership overall rose during the 1990s and early 2000s as the Internet made it easier and cheaper to conduct trades, but it's still more common among those who are more financially literate and have greater levels of trust in others and in the stock market, as measured both by credit scores and by responses to survey questions.
It's less common among African Americans, those who've experienced difficulty paying their mortgages, and -- perhaps not so surprisingly -- those who've lost money in the stock market before. (Market participation in general is about a third lower than it was at the turn of the century, with a large drop off during the great recession.)
According to IRS tax data, stock ownership is also three points less common in states that Trump won in the 2016 presidential election than those Hillary Clinton won.
Related: 10 years after the recession, have Americans recovered?
There is one state, however, that bucks most of those associations. Utah has the lowest stock ownership rate in the country among mid to high earners, making between $100,000 and $200,000. It's less racially diverse than most states, has higher than average credit scores, and a comprehensive financial literacy course in high schools.
As with many outliers, there may be something else going on in Utah. Alan Battles, president of Brighton Wealth Management in Murray, Utah, has a few theories. Utahans prefer to invest in real estate, for one thing, and a lot of the state's large public companies that had a lot of local ownership have been bought out in recent years.
But the most likely factor? Utah also has the highest fertility rate in the country, at 2.29 children per couple, and those large families cost money that might otherwise go into stock portfolios.
"A hundred thousand or $200,000 goes a little less far as discretionary income when you have four or five kids than when you have one or two kids," Battles says.
And that, of course, pays a different kind of dividend.


