|
Manufacturing pace eases
|
 |
May 1, 2000: 10:24 a.m. ET
NAPM index slips to 54.9 in April; construction spending hits record
|
NEW YORK (CNNfn) - U.S. manufacturing activity expanded at a slightly slower pace in April while prices paid for materials declined from a near five-year high, a trade report released Monday showed, suggesting producers are turning out slightly fewer goods and paying a bit less to suppliers.
Meanwhile, construction spending advanced at a faster-than-expected pace, according to a government report.
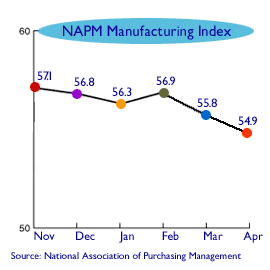
 The National Association of Purchasing Management said its index of manufacturing activity slipped to 54.9 in April from 55.8 in March; its second monthly drop and below the 55.5 reading expected by analysts polled by Briefing.com. The "prices paid" component -- a measure of producers' costs -- slipped to 76.0 in April from a near five-year high of 79.8 the month before. The prices-paid portion of the index hit its peak at 81.7 in February 1995. The National Association of Purchasing Management said its index of manufacturing activity slipped to 54.9 in April from 55.8 in March; its second monthly drop and below the 55.5 reading expected by analysts polled by Briefing.com. The "prices paid" component -- a measure of producers' costs -- slipped to 76.0 in April from a near five-year high of 79.8 the month before. The prices-paid portion of the index hit its peak at 81.7 in February 1995.
A reading of 50 or higher in a NAPM index typically indicates accelerating output. The overall index has been at 50 or higher since February 1999.
The numbers confirmed that U.S. manufacturing activity is still going strong, but that costs for manufacturers are starting to ease, a situation that could take pressure off producers to pass on the rising costs to consumers. The report also showed that overall production slowed, inventories rose and new orders declined last month, though employment picked up a notch.
The NAPM, an organization that provides information and resources for the purchasing profession, surveys some 350 of its 45,000 members each month to track economic activity in 20 industries across the United States. Purchasing managers are the people who buy and sell the goods and services a company needs to produce its final products.
A slower expansion
The factory sector is still expanding, but at a slower pace than for most of the last seven months," said Steven Wood, an economist with Banc of America Securities in San Francisco. "The slowdown in manufacturing activity will be welcomed at the Federal Reserve, where any sign of economic slowing will be cheered."
 Indeed, most economists expect the Federal Reserve to raise short-term interest rates by least a quarter point at its next policy meeting May 16 - the sixth such increase since June -- to reign in the U.S. economy and keep inflation in check. The fed funds rate -- the target rate for overnight loans between banks -- currently rests at 6 percent. Indeed, most economists expect the Federal Reserve to raise short-term interest rates by least a quarter point at its next policy meeting May 16 - the sixth such increase since June -- to reign in the U.S. economy and keep inflation in check. The fed funds rate -- the target rate for overnight loans between banks -- currently rests at 6 percent.
While the NAPM's numbers indicated a general decline in the pace of manufacturing output last month, they probably won't deter the Fed from going ahead and raising rates at its upcoming policy meeting, according to Sherry Cooper, chief economist with brokerage BMO Nesbitt Burns.
Red-hot economy
"I do believe there is still evidence that the economy is red hot, and I think the Federal Reserve will be monitoring the income numbers closely to decide whether to go 25 basis points or 50 at their upcoming policy meeting," Cooper told CNNfn. (432KB WAV) (432KB AIFF)
The NAPM's new orders index, which measures current demand, slipped to 56.3 in April from 56.9 in March. Its production index, which measures the current pace of manufacturing output, fell to 58.2 from 61.8, while its index of order backlogs was unchanged on the month at 51.0.
 Its suppliers' delivery index -- which measures how much demand there is from customers to receive their goods -- rose to 55.6 from 54.1. Its inventory index -- another gauge of pent-up demand -- fell to 45.2 from 48.4, while its employment index -- which measures companies' hiring plans as well as labor market conditions -- rose to 53.2 in April from 51.5 in March. Its suppliers' delivery index -- which measures how much demand there is from customers to receive their goods -- rose to 55.6 from 54.1. Its inventory index -- another gauge of pent-up demand -- fell to 45.2 from 48.4, while its employment index -- which measures companies' hiring plans as well as labor market conditions -- rose to 53.2 in April from 51.5 in March.
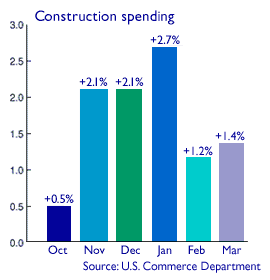
Separately, the U.S. Commerce Department reported Monday that construction spending jumped 1.4 percent to a record last month, well above the flat reading expected by economists and above the revised 1.2 percent gain recorded the month before. 
|
|
|
|
|
 |

|

