|
U.S. income, spending up
|
 |
October 30, 2000: 1:57 p.m. ET
September income jumps, spending close behind; savings rate still negative
By Staff Writer M. Corey Goldman
|
NEW YORK (CNNfn) - Americans' incomes posted their biggest jump in nearly a year in September while spending also rose and the savings rate remained mired near an all-time low. Excluding a one-time subsidy to U.S. farmers, though, overall incomes gained at a more moderate pace.
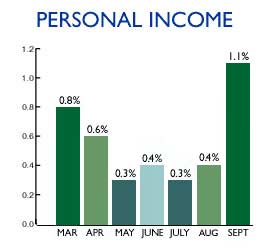 Personal incomes rose 1.1 percent last month, the Commerce Department reported Monday, well above the 0.6 percent gain expected by economists and August's 0.4 percent increase. It was the largest monthly gain in incomes since a 1.3 percent jump in October 1999. Personal incomes rose 1.1 percent last month, the Commerce Department reported Monday, well above the 0.6 percent gain expected by economists and August's 0.4 percent increase. It was the largest monthly gain in incomes since a 1.3 percent jump in October 1999.
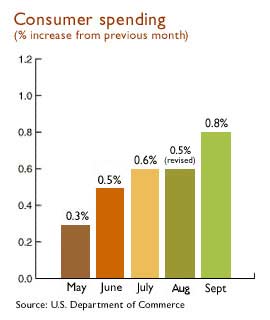
Meanwhile, spending rose 0.8 percent, above forecasts and the revised 0.5 percent increase in August. And the savings rate came in at a negative 0.1 percent, up from an all-time low the month before. August's savings rate, the lowest since the department began keeping records back in 1959, was unrevised at negative 0.4 percent.
The numbers offered a mixed message for economists and investors. On the surface, they paint a picture of U.S. households earning and spending more -- a situation the Federal Reserve has been trying to temper for the past year or so by periodically raising short-term interest rates.
Income, spending gains still moderate
Still, much of last month's gains came from a surge in government subsidies paid to farmers, suggesting spending may be moderating somewhat. Excluding the one-time subsidy, income levels rose 0.4 percent.
"Slower output and employment growth is dampening real income gains, which in turn is slowing spending," said Steven Wood, an economist with Banc of America securities in San Francisco. "Although the monthly data continue to be quite volatile during this transition period, the underlying trends are unmistakable -- the economy is slowing from its torrid pace."
Financial markets registered little reaction to the numbers, mostly because they come in the face of near-record U.S. employment, which naturally encourages people to spend more and save less. Consumer spending accounts for about two-thirds of the nation's output of goods and services.
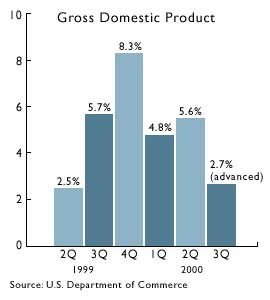 While recent data show that U.S. growth slowed dramatically in the third quarter, ample jobs and rising incomes have kept spending -- and the record economic expansion -- strong. While U.S. gross domestic product slowed to 2.7 percent in the third quarter, personal spending rose at a 4.5 percent annualized pace, well above the 2.9 percent pace posted in the second quarter. While recent data show that U.S. growth slowed dramatically in the third quarter, ample jobs and rising incomes have kept spending -- and the record economic expansion -- strong. While U.S. gross domestic product slowed to 2.7 percent in the third quarter, personal spending rose at a 4.5 percent annualized pace, well above the 2.9 percent pace posted in the second quarter.
That could pose a problem going forward if Fed officials don't feel that their six rate increases implemented during the past 18 months are damping consumers' desire to spend, said Tim Rogers, Briefing.com's chief economist. (456KB WAV) (456KB AIFF)
Personal consumption expenditures, or PCE, rose 0.4 percent in September after being flat in August. Excluding volatile food and energy prices, the index rose 0.2 percent last month after a 0.1 percent August gain. The index measures what amount of income is specifically going to purchase goods and is used as an inflation gauge by economists and the Fed.
More than willing to spend
Americans have remained more than willing to buy as optimism about job security has fueled confidence. The unemployment rate was 3.9 percent in September, tying the three-decade low reached in April. Excluding the effect of the return of striking workers and the loss of Census jobs, the economy added 204,000 jobs in September, according to Labor Department figures.
 That helped lift consumer confidence close to an all-time high set in January and matched in May. The Conference Board's index of consumer confidence increased to 141.9 in September, close to a record high of 144.7. That helped lift consumer confidence close to an all-time high set in January and matched in May. The Conference Board's index of consumer confidence increased to 141.9 in September, close to a record high of 144.7.
"After a spring lull, consumers are back on track," said Sherry Cooper, chief economist with BMO Nesbitt Burns. "While we do expect some cooling in the fourth quarter due to the pinch from higher energy prices, spending growth remains remarkably resilient."
Spending on durable goods rose 1.5 percent in September, the biggest increase since a 1.7 percent jump in February. Sales of automobiles and parts fueled most of those gains. Purchases of non-durable goods increased 0.9 percent, the largest gain since March.
Disposable income, or the money left in people's pockets after taxes, increased 1.1 percent in September after rising 0.4 percent during August.
One factor that could damp both confidence and spending going forward is the volatile stock market. The Standard & Poor's 500 index has fallen 6 percent this year and the Nasdaq Composite index has declined more than 10 percent. Both indexes posted double-digit percentage gains last year. 
|
|
|
|
|
 |

|