Are you an iPhone user? Congratulations! You're probably smarter than the Android owner sitting next to you.
A new study conducted by online advertising network Chitika found that states with more college graduates tend to also have higher iPhone sales.
Alaska (66%), Montana and Vermont have the largest percentage of iPhone users. New Mexico (41%), Iowa and Delaware have the lowest share of iPhone sales per capita.
Notably, Chitika found that increased wealth is also linked to greater iPhone sales -- but since college degrees also correlate with higher incomes, Chitika says those results are redundant.
Other studies have found similar results. Rich, white males tend to buy more iPhones, particularly in the first weeks that they go on sale.
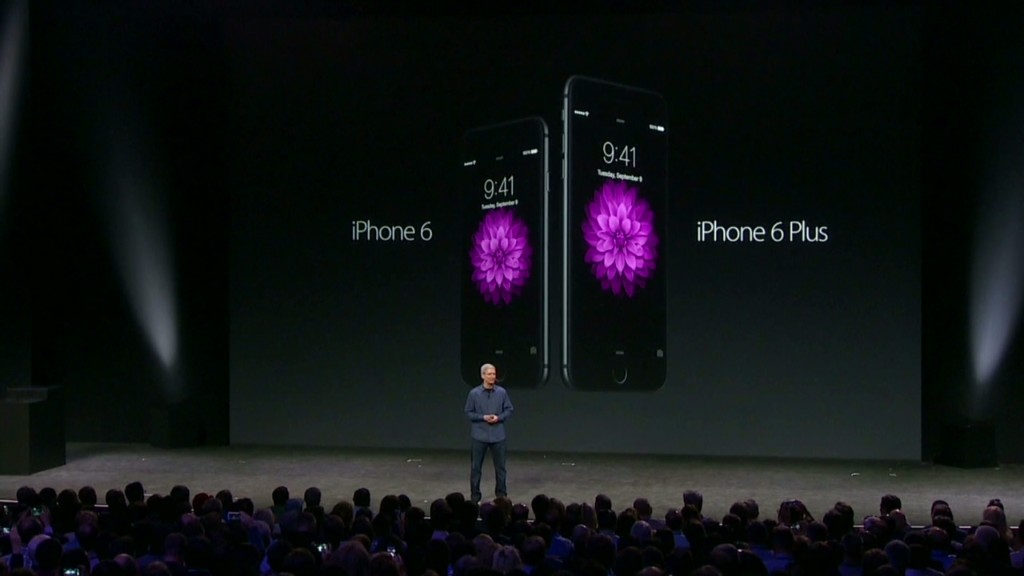
In the first month of sales, nearly 80% of iPhone 6 and iPhone 6 Plus buyers in the United States were male, and more than 60% made over $75,000 a year, according to Slice, a company that tracks consumer purchases.

Related: Vast majority of iPhone 6 buyers are rich, white men
The study also notes that iPhone sales correlate to population density. The more densely populated the state, the greater the chance that iPhone sales will be higher in that state.
On a whole, Google's (GOOGL) Android sales are significantly higher than Apple's (AAPL) sales, but the iPhone remains the single most popular smartphone in the United States. More than 42% of U.S. smartphones are iPhones, according to comScore. Runner-up Samsung commands 28% of the U.S. market.
Yet it's important to take Chitika's results with a grain of salt. Even Chitika admits that its results "are not comprehensive." Because the company focused on states and not smaller regions, such as cities or neighborhoods, the results lack "a great deal of granularity."
Here's the state-by-state breakdown, according to Chitika.
- Alaska: 65.5%
- Montana: 60.1%
- Vermont: 59.4%
- Hawaii: 58.7%
- Mississippi: 58.7%
- Connecticut: 58.1%
- Massachusetts: 56.6%
- New York: 56.2%
- Kansas: 55.6%
- New Jersey: 55.3%
- California: 53.3%
- Louisiana: 53.3%
- South Dakota: 52.9%
- West Virginia: 52.4%
- New Hampshire: 52.1%
- Rhode Island: 52%
- Illinois: 51.5%
- Georgia: 50.8%
- Idaho: 50.8%
- Kentucky: 50.5%
- Nevada: 50.5%
- Arkansas: 50.4%
- Maine: 50%
- Virginia: 50%
- Oregon: 49.7%
- Pennsylvania: 49.5%
- Wyoming: 49.5%
- Nebraska: 49%
- Utah: 49%
- North Dakota: 48.5%
- Colorado: 48.3%
- Minnesota: 48.3%
- Tennessee: 48.0%
- Maryland: 47.8%
- South Carolina: 47.2%
- Alabama: 47.1%
- Ohio: 46.3%
- North Carolina: 46.2%
- Florida: 45.8%
- Oklahoma: 45.1%
- Texas: 44.9%
- Arizona: 44.6%
- Indiana: 44.6%
- Michigan: 43.8%
- Missouri: 43.6%
- Washington: 43.6%
- Wisconsin: 43.1%
- Delaware: 42.2%
- Iowa: 42.1%
- New Mexico: 40.5%

