Low unemployment. Stock market records. Rising home prices. The US economy is in pretty good shape today.
Ten years ago, it was about to fall off a cliff.
This month is the anniversary of the meltdown in financial markets, which turned a regular recession into the Great Recession. Millions of people lost their jobs, and millions more lost their homes.
The recovery has been uneven, but the progress is impressive.
The country has added jobs every month for almost eight years. Home prices bottomed out six years ago and have been rising ever since. And the bull market that began in 2009 is now the longest in history, and still going strong.
Here's how today's economy compares with the dark days of 2008.
Jobs
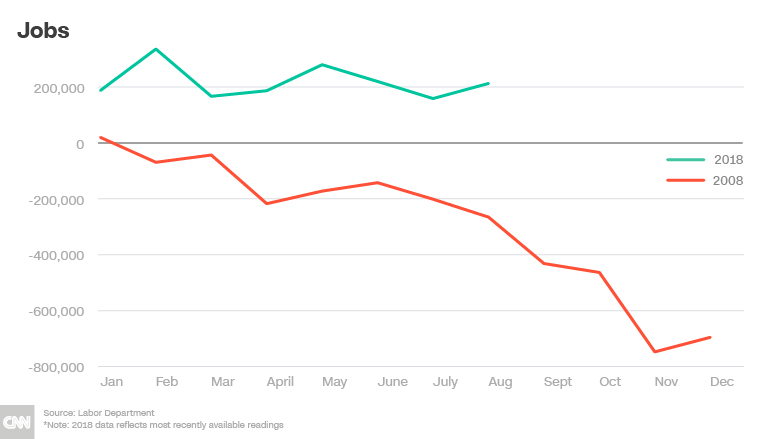
Earlier in 2008, the economy was losing about 170,000 jobs a month. After the meltdown in September, things went from bad to worse. The economy lost more than 700,000 jobs in the last two months of the year.
This year, the economy has added about 200,000 jobs a month, and the biggest problem in the job market is that employers are having trouble finding workers.
Unemployment
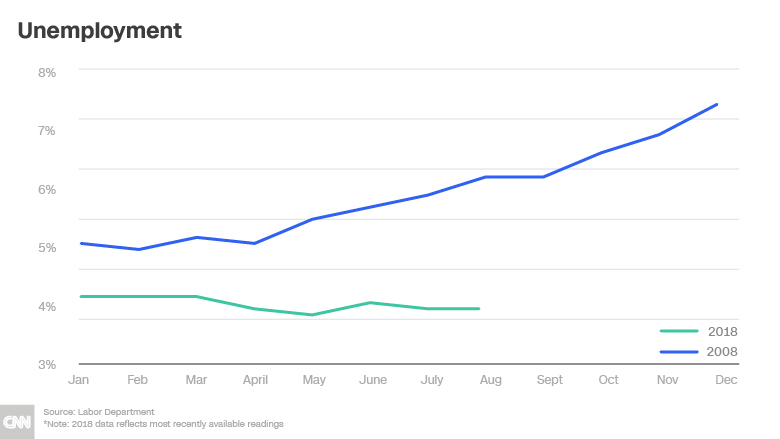
As companies shed jobs in 2008, the unemployment rate climbed quickly, on its way to a high of 10% in October 2009.
Today the unemployment rate is 3.9%, low by historical standards. For almost two years, it's been below 5%. That is the rate considered by many economists to represent full employment, when most everyone who wants a job can find one.
Housing
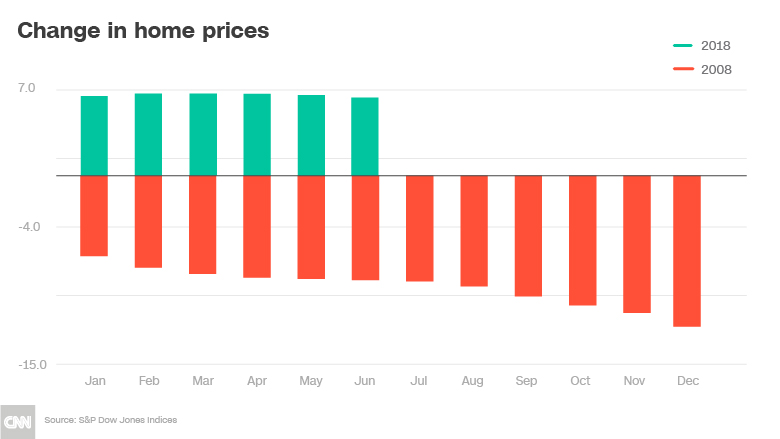
The financial crisis was set in motion by the bursting of a bubble in housing prices in 2006. Falling home prices wiped out the wealth of many American households and resulted in a jump in mortgage foreclosures, which caused huge losses at Wall Street banks.
By the end of 2008, prices were down 12% from a year earlier. Prices kept falling until 2012, hitting bottom at 27% below the peak. Then they began a steady recovery that continues through today. Prices now are about 11% above the 2006 high.
Economic growth
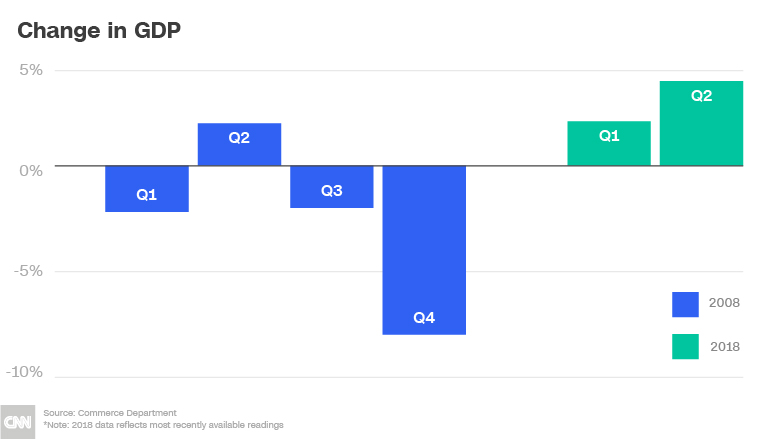
Gross domestic product, one of the broadest measures of the nation's economic activity, showed a drop in 2008 for the first time in seven years. Congress responded with $90 billion in tax cuts to spur spending, but it was too little, too late.
After a brief rebound in the spring, the economy fell hard in the third quarter, and by the end of 2008 had posted the biggest quarterly drop in 50 years.
But the economy has grow steadily since then, producing the second longest economic expansion in US history. In the second quarter of this year, the growth rate was a strong 4.2%.
Stocks
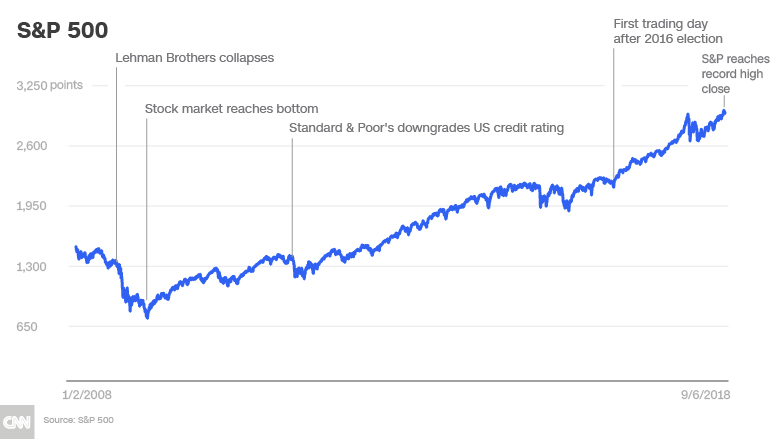
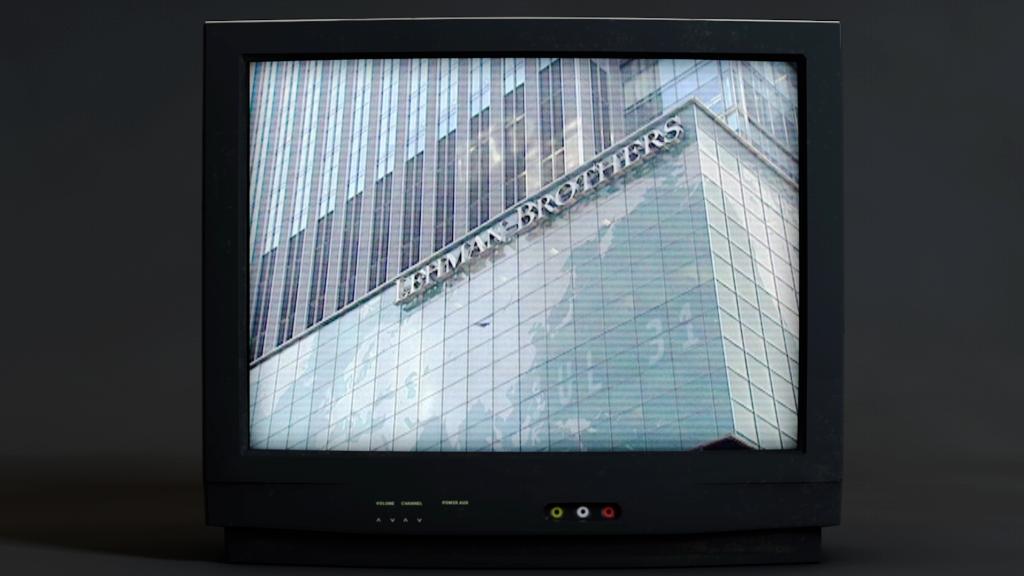
The bankruptcy of Lehman Brothers in September, and Congress' initial rejection of a bank bailout later in the month, both caused huge drops in the market.
Stocks hit their bottom in March 2009 and have been climbing for more than nine years. The S&P 500 has more than quadrupled.
