The stock market has been ugly lately.
There are those who say this is only the beginning. Get ready for a deeper crash. Then there are those who argue this is just a healthy blip and that stocks will keep going up. Goldman Sachs (GS), for example, still predicts the market will end the year higher (albeit modestly).
Time will tell who is right. But remember that we live in an era where computer trading dominates the American stock market. The "robots" that are making a lot of trading calls aren't sitting around pondering China's economy. They are paying attention to whether stocks fall below key levels.
What are those levels? No one knows exactly. But these two metrics are worth watching. If these thresholds are crossed, both computer and human traders will consider it a game-changer point.
Related: Why U.S. stocks aren't headed for a crash
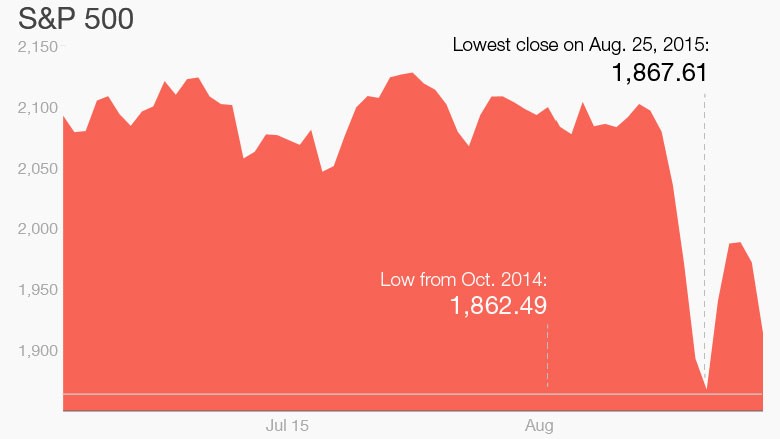
1. S&P 500 at 1,865
At the worst of the August selloff, the S&P 500 index closed at 1,867.61. It was hard to watch. The correction was finally here. While the market has continued to swing pretty wildly since then, it hasn't gotten back to that low point.
Even more importantly, the S&P 500 didn't fall below the lowest close from October 2014 of 1,862.49. If that happens, it means a year of gains is gone.
"I still believe that the current correction's closing low was made last Tuesday at 1867.61," wrote Ed Yardeni, president and chief investment strategist of Yardeni Research, in a note to clients.
A lot of traders watch for when the S&P 500 gets below 1,900, but the real panic will set in if the index drops under about 1,865. That's likely the new new game-changer level, at least when it comes to momentum. (Currently, the S&P 500 is sitting at about 1,950).
Related: The stock market is crazy, but don't panic
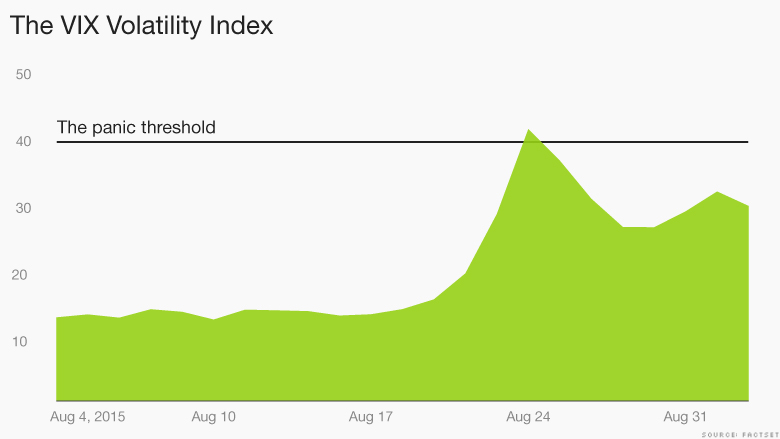
2. VIX fear factor index above 40
The other factor traders (and computer algorithms) watch is volatility, specifically the VIX Volatility Index.
Trader Tim Anderson, the managing director of MND Partners, notes that most investors have never heard of the VIX. But it matters on the trading floor.
"It's really a fear or panic indicator," he says.
Traders actually like a little bit of volatility because they tend to make more money when more stocks are moving. But like everything in life, there's too hot as well as a Goldilocks point.
In the past decade, the average level of the VIX has been 20. Think of that as normal. When the VIX gets above 30, it puts people on a bit of alert. That's about the level the VIX is at now.
But the panic doesn't set in until the VIX climbs above 40 and closes there. That happened only once last week -- on Monday, August 24. After that spike, the VIX came back down.
In the past decade, the only other times the VIX has surged above 40 and stayed there for a few days have been during the financial crisis (the VIX closed at a high of 80 in November 2008) and in August 2011 during the worst of the debt ceiling standoff between Congress and President Obama. That was when Standard & Poor's stripped America of its AAA debt rating status.
When the VIX gets above 40 and stays there, it's another game changer. We're not there yet.

