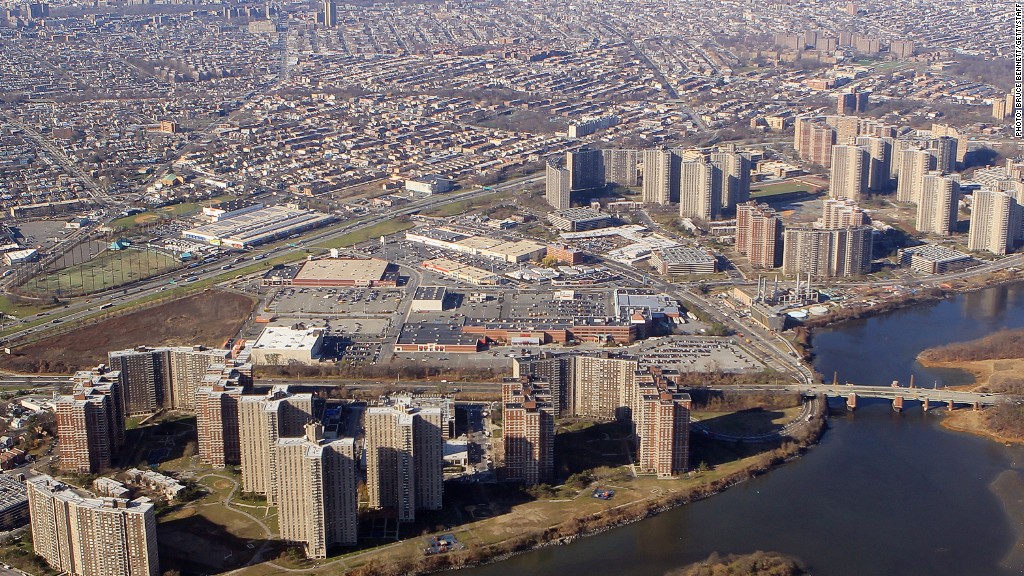
Home to the Yankees and often called the birthplace of hip hop, the Bronx now has another famous moniker: the country's most unaffordable rental market.
Tenants in the northern-most borough of New York City can expect to pay almost 68% of their income toward rent, with the 2015 fair market rent being $1,904 a month.
Buying a home is more affordable than renting in the majority of U.S. housing markets, according to a recent report from RealtyTrac.
Purchasing a median-priced home was more affordable than renting a three-bedroom home in 68% of the 473 counties analyzed by RealtyTrac. On average, renters are expected to spend 27% of their median household income on payments to landlords next year. Meanwhile, becoming a homeowner will require an average of 25% of income to cover the mortgage.
Historically-low interest rates have helped maintain home affordability despite the recent rise in home prices. But if rates tick up just a little higher, Daren Blomquist, vice president at RealtyTrac, said affordability could shift to favor more renters.
New York's multimillion dollar home sales keep soaring
But there are some markets where residents really don't have any good housing options: both renting and buying are costly. In the least affordable rental markets, residents can expect to contribute 42% of their median household income on average to cover rent, the report stated. Buyers in the same markets can expect to dole out 44% of their income buying a median-priced home.
The average rent of the top 25 least affordable counties is $1,686 a month, $462 higher than the national average. Counties where rents were least affordable also include Philadelphia, Miami, San Francisco, Baltimore and Los Angeles.
New York City's most expensive rental costs $500,000 a month
And it looks like millennials are catching another tough break from the housing market. Counties making the list of least affordable rental markets have experienced strong millennial migration in the last six years compared to the national average.
Here are RealtyTrac's top 10 least affordable rental markets in the U.S., based on how much of the average median income goes toward rent in the county:
| | | |
|---|---|---|
Location | Percent of Median Income to Rent | |
Bronx, NY | 67.57% | |
Baltimore City, MD | 49.64% | |
Philadelphia, PA | 47.40% | |
Brooklyn, NY | 47.33% | |
Miami-Dade, FL | 45.51% | |
Broward, FL | 42.76% | |
Norfolk City, VA | 42.69% | |
San Francisco, CA | 42.65% | |
Humboldt, CA | 41.99% | |
Los Angeles, CA | 41.95% |


