3 of 6
BACKNEXT
Minneapolis
Minneapolis
Current price: $114,900
# of reductions: 7
Total price cut: 21%

It wasn't supposed to be like this in Minneapolis. Like most other Midwestern metropolises, the Twin Cities showed moderate gains during the housing boom. They could have held up, but they haven't.

Since peak in April 2006, values have fallen 34%, with 8% of that loss coming over the past six months. Homes are now only worth 14% more than in 2000.

Sellers in Minneapolis have had to rethink their expectations over the past half year. They have been waiting an average of 45 days before they cut their prices to better match the market, according to data from Trulia, and cut the price an average of 9%.

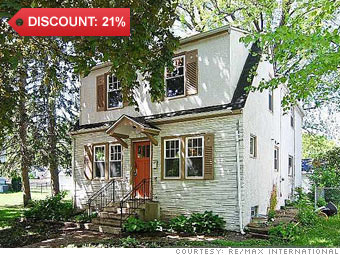
This roomy house located four miles northwest of downtown has gone through seven price reductions since last June, dropping 20% to $114,900.

Edie Sher, the agent for this listing said, "To be competitive, you want to price it below market value. You have to be aggressive."

Much of the area's latest home price decline has happened far from the core, according to Tom Streitz, director of Housing Policy and Development for the city. "Our numbers are down and foreclosures are up in the suburbs," he said.


NEXT: Detroit
Last updated April 07 2011: 4:32 PM ET
Source: Market data from Trulia
Inside Christina Aguilera's home This Beverly Hills mansion has a rock n' roll pedigree. More
Where to rent vs. buyDetroit and Columbus boast killer deals, but you should rent in NYC and Seattle. More
America's ugliest homes From the "We Buy Ugly Homes" people More
  • Find Homes for sale
    Real estate and homes for sale on Trulia

  • Property Type
  • Find a home in:
  • New York | Atlanta | Chicago | Los Angeles
  • Washington D.C | Houston | Philadelphia | More options
Overnight Avg Rate Latest Change Last Week
30 yr fixed3.80%3.88%
15 yr fixed3.20%3.23%
5/1 ARM3.84%3.88%
30 yr refi3.82%3.93%
15 yr refi3.20%3.23%
Rate data provided
by Bankrate.com
View rates in your area
 
Find personalized rates:
Special Offer

Most stock quote data provided by BATS. Market indices are shown in real time, except for the DJIA, which is delayed by two minutes. All times are ET. Disclaimer. Morningstar: © 2018 Morningstar, Inc. All Rights Reserved. Factset: FactSet Research Systems Inc. 2018. All rights reserved. Chicago Mercantile Association: Certain market data is the property of Chicago Mercantile Exchange Inc. and its licensors. All rights reserved. Dow Jones: The Dow Jones branded indices are proprietary to and are calculated, distributed and marketed by DJI Opco, a subsidiary of S&P Dow Jones Indices LLC and have been licensed for use to S&P Opco, LLC and CNN. Standard & Poor's and S&P are registered trademarks of Standard & Poor's Financial Services LLC and Dow Jones is a registered trademark of Dow Jones Trademark Holdings LLC. All content of the Dow Jones branded indices © S&P Dow Jones Indices LLC 2018 and/or its affiliates.