On March 24, 1989 the Exxon Valdez oil tanker hit the Bligh Reef off the coast of Alaska and spilled more than 11 million gallons of crude oil. That ship was bringing crude from oil-rich Alaska, to the oil-hungry lower 48 states. Since then, the U.S. has gone through a transformation in oil production. Demand skyrocketed and initially the U.S. responded with a sharp rise in imports. But since hitting a high in 2005, imports have dropped, while domestic production surges.
Here's four charts that show how the oil industry has changed since 1989:
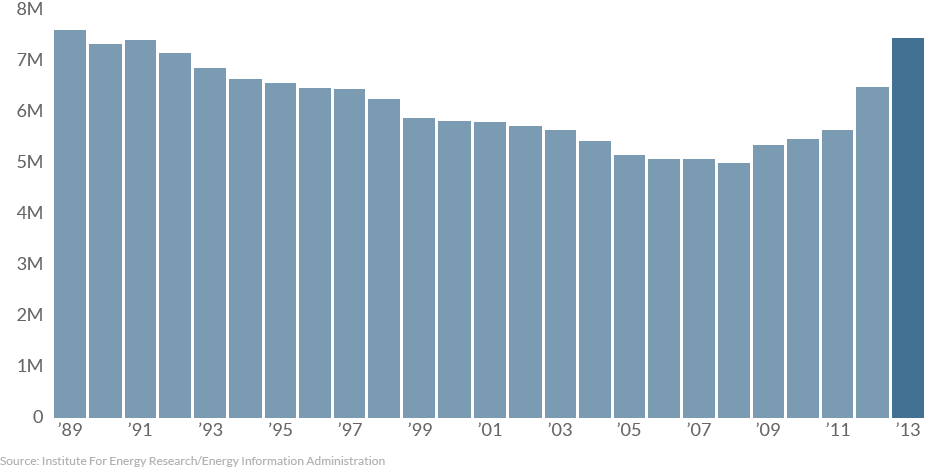
U.S. oil production reached 7.5 million barrels per day in 2013 (that's 315 million gallons), according to the U.S. Energy Information Administration. The last time it was at that level was 1989. Two of the biggest contributors are the Eagle Ford shale formation in Texas and the Bakken shale in North Dakota. The EIA says each contribute more than 1 million barrels a day.
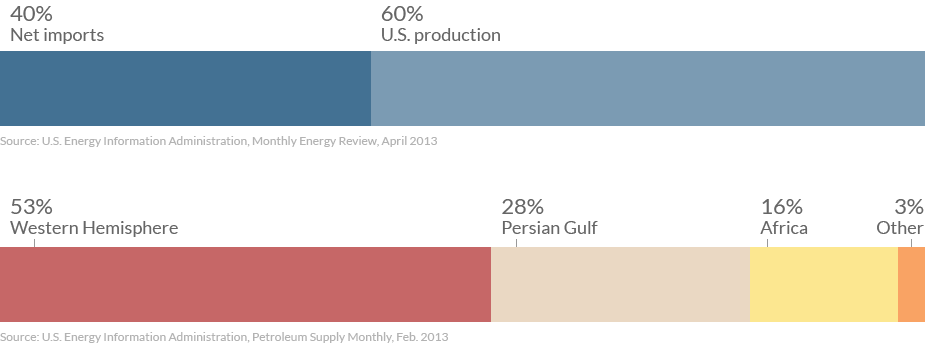
In 2012, imports provided about 40% of U.S. oil. That number could decrease once 2013 data comes out later this year. 53% of those imports come from the western hemisphere, with Canada sending the largest share.
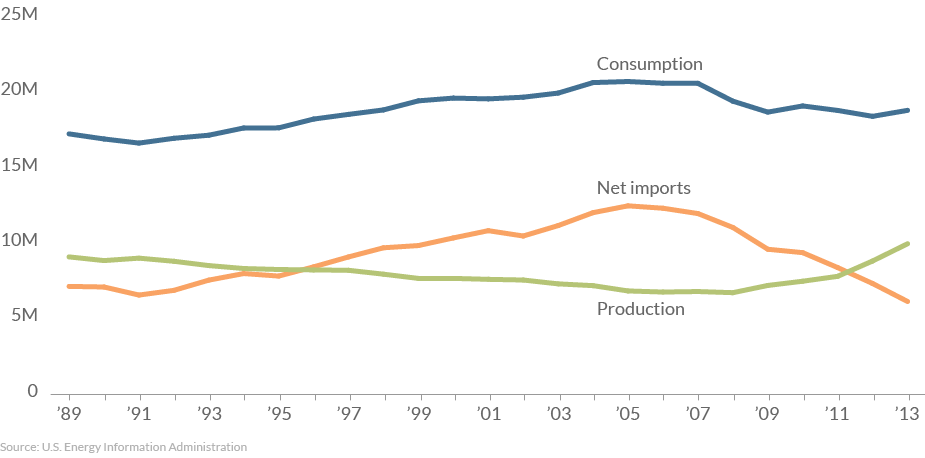
Consumption has risen steadily since 1989, with the only significant drop coming as the economy plunged into
the Great Recession. Below you can see in the 1990s when imports crossed production and didn't drop until 2005.
But in 2010, that trend was reversed, and the U.S. began producing more petroleum that it imported. Experts say that trend will continue.
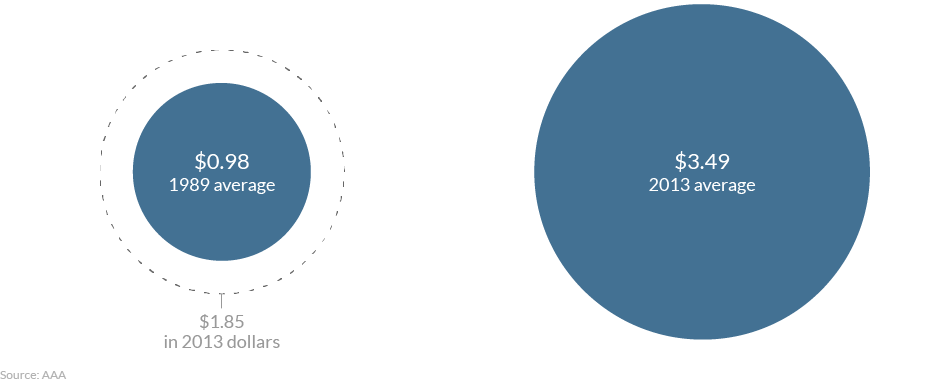
The payoff for consumers was apparent in 1989. The average gallon of regular unleaded that year sold for $0.98. That's $1.85 in 2013 dollars, adjusted for inflation. But last year, the average gallon was $3.49, according to AAA. The nationwide average this week is hovering around $3.50. Higher taxes and production costs account for some of the discrepancy, but just because the U.S. is producing more oil, doesn’t mean drivers will feel it at the pump.

Twenty five years ago on March 24, more than 11 million gallons of crude oil spilled into Alaska's Prince William Sound after Capt. Joseph Hazelwood ran the Exxon Valdez into Bligh Reef.

Exxon Mobil has agreed to shareholder demands to report on how climate change will impact its business.

CNN's Kyra Phillips takes a close look at what went wrong on the Exxon Valdez with the ship's captain, Joseph Hazelwood.


