6 of 100
BACKNEXT
6. lululemon athletica
lululemon athletica

3-year average
Revenue Growth: 45%
Profit Growth: 81%
Total Return: 109%

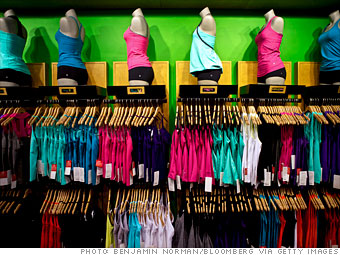
When is a pair of yoga pants not just a pair of yoga pants? For some fashion-conscious folk, the small-yet-distinctive Lululemon signature squiggle is what sets them apart. Moving into the top 10 (up seven spots from where it first appeared on last year's list) this maker of long-lasting, cut-above yoga apparel continues to impress. Revenue surged 41% in 2011 which management attributed to the addition of 41 new stores and existing-store sales growth of 22%. The Vancouver-based outfit ditched the franchise model and now has more than 180 corporate-owned locations in Canada, the U.S., Australia and New Zealand. Lululemon has also been increasing its online presence which, the company says, is an increasingly important part of its growth strategy, now representing more than 10% of net revenue. -- N.S.

Get stock quote: LULU
Revenue ($ millions): $1,100
Net Income ($ millions): $197
Sectors: Retail
What businesses do you think are primed to grow in this economy?
From the September 24, 2012 issue.

Northern Oil and Gas 237%
ZAGG 104%
Green Mountain Coffee Roasters 78%
Cirrus Logic 450%
IAMGOLD 421%
HFF 341%
Questcor Pharmaceuticals 120%
3D Systems 112%
TPC Group 111%
To qualify, a company -- domestic or foreign -- must be trading on a major U.S. stock exchange; file quarterly reports to the SEC; have a minimum market... More
Current Issue
  • Give the gift of Fortune
  • Get the Fortune app
  • Subscribe

Most stock quote data provided by BATS. Market indices are shown in real time, except for the DJIA, which is delayed by two minutes. All times are ET. Disclaimer. Morningstar: © 2018 Morningstar, Inc. All Rights Reserved. Factset: FactSet Research Systems Inc. 2018. All rights reserved. Chicago Mercantile Association: Certain market data is the property of Chicago Mercantile Exchange Inc. and its licensors. All rights reserved. Dow Jones: The Dow Jones branded indices are proprietary to and are calculated, distributed and marketed by DJI Opco, a subsidiary of S&P Dow Jones Indices LLC and have been licensed for use to S&P Opco, LLC and CNN. Standard & Poor's and S&P are registered trademarks of Standard & Poor's Financial Services LLC and Dow Jones is a registered trademark of Dow Jones Trademark Holdings LLC. All content of the Dow Jones branded indices © S&P Dow Jones Indices LLC 2018 and/or its affiliates.