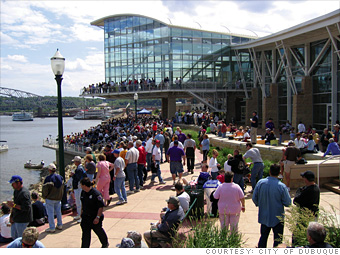
CNNMoney.com > Small Business > Best Places to Launch

  • Top large places
  • Top midsize places
  • Top small places
  • All metro areas
  • States
  • Cities
  • Lending hot spots
  • Cities
  • Fastest small business growth
  • Educated workers
  • Low crime
  • High income
  • Growing economy
  • Low wages
  • Best tax climate
  • Affordable rents
  • Fewest foreclosures
38 of 50
BACKNEXT
Dubuque, IA
Dubuque
MSA: Dubuque, IA
Best places ranking: #8 among small metro areas
Population: 92,724

The oldest city in Iowa, Dubuque retains its historic roots in manufacturing through the presence of factories owned by John Deere and an under-construction plant for Hormel Foods. But with three colleges in its midst, Dubuque also offers a highly educated workforce. The insurance industry has a strong presence here, and IBM recently opened a service center that plans to hire up to 1,300 workers by the end of next year.

While a credit crunch has dried up small business capital throughout much of the country, entrepreneurs say the area's banks and credit unions have stayed active. Heartland Financial, a financial services company that holds deposits of more than $2 billion, continues to call Dubuque home.

If there's one downside to Dubuque, it's the weather: Temperatures in Dubuque, which is located in the snow belt, can hit 20 below, and the city averages 50 inches of snow a year. But summer in Dubuque makes up for it: the city is bursting with farmers' markets, festivals and state and county fairs. -Coeli Carr

Launch Toolbox:
Resources for getting started in Dubuque, IA

BORROW

Local smallbiz lenders

  • Ohnward Bancshares
  • QCR Holdings
  • Northwest Investment Corp.
  • Hills Bancorporation
  • Dupaco Community Credit Union
See all local lenders

Dubuque Business Statistics
Employer establishments with 1-49 employees
(2007)
2,585 3,516
Small business growth rate
(2004-2007)
2.1% 4.1%
State business tax climate ranking
(out of 50 states)
44 N/A
Percentage of population with bachelor's degree
(ages 25-34)
37.8% 23.5%
Violent crime
(rate per 100,000 inhabitants, 2007)
504.6 385.1
Property crime
(rate per 100,000 inhabitants, 2007)
2,424.8 3,395.2
Population growth
(2003-2008)
2.9% 4.93%
Per-capita income
(2007)
$33,505 $31,933
Per-capita income growth
(2002-2007)
23.4% 23.6%
GDP (in millions)
(2006)
$4,000 $4,952
GDP growth
(2001-2006)
37% 33%
Average hourly wage
(2008)
$16.34 $17.50
Housing foreclosure rate
(first half of 2009, 1 per every X housing units)
6,470 850
Median rent
(2009, for a 2-bedroom housing unit)
$600 $737
Housing price-to-income (HPI) ratio
(first quarter of 2009)
1.5% 1.8%
Long-term HPI ratio
(20-year average, 1984-2004)
1.4% 1.7%
HPI deviation from long-term average
7% 0.1%

All statistics are for the full Metropolitan Statistical Area. For a complete list of data sources, see "How we picked the Best Places."

Note: An earlier version of this profile listed an incorrect unemployment rate for Dubuque and citied the Hormel and IBM facilities as fully operational. Both are still in the ramping-up stage.
From the November 2009 issue
"Every time you step out into Main Street is a networking opportunity. The folks at the local UPS know us by name and even recognize my voice." -Ann McDonough
Best Places Winners
MAPS
What do you think of Dubuque?
Video
Find your launch spot
Do you prefer a place that is: Small Medium Large
The factors that matter most to me are:
 Affordable wages  Few foreclosures
 Educated workers  Low housing costs
 Low crime  High local incomes
 A growing economy  Population growth
 Growing small business population

ireportTell us why: Low taxes? Talented workers? An active small business community? Send us your photos and videos, and you could be featured in our upcoming coverage of reader-picked Best Places to Launch. More
This year we partnered with the Ewing Marion Kauffman Foundation to find the 50 most business-friendly communities in America.

With help from Robert Fairlie, an economist and leading scholar of entrepreneurship at the University of California, Santa Cruz, we developed a methodology and sifted through such data on factors such as per capita income, hourly wages, workforce quality, crime rates, taxes and foreclosures. More

Comments? E-mail the editors
Data partners

This package was produced in partnership with the Ewing Marion Kauffman Foundation.

Foreclosure data provided by RealtyTrac.

Housing price-to-income data provided by Moody's Economy.com.

Most stock quote data provided by BATS. Market indices are shown in real time, except for the DJIA, which is delayed by two minutes. All times are ET. Disclaimer. Morningstar: © 2018 Morningstar, Inc. All Rights Reserved. Factset: FactSet Research Systems Inc. 2018. All rights reserved. Chicago Mercantile Association: Certain market data is the property of Chicago Mercantile Exchange Inc. and its licensors. All rights reserved. Dow Jones: The Dow Jones branded indices are proprietary to and are calculated, distributed and marketed by DJI Opco, a subsidiary of S&P Dow Jones Indices LLC and have been licensed for use to S&P Opco, LLC and CNN. Standard & Poor's and S&P are registered trademarks of Standard & Poor's Financial Services LLC and Dow Jones is a registered trademark of Dow Jones Trademark Holdings LLC. All content of the Dow Jones branded indices © S&P Dow Jones Indices LLC 2018 and/or its affiliates.