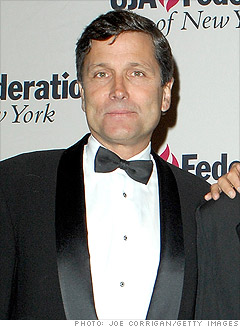
3. Stephen B. Burke, $31.3 million
Stephen B. Burke,  $31.3 million
Comcast Executive Vice President Stephen Burke
Title: Formerly COO; now Executive VP, Comcast and CEO, NBCUniversal
Company: Comcast (CMSCA)
CEO: Brian L. Roberts, $28.2 million
Pay difference: $3.1 million

Burke took over as head of NBCUniversal in January 2011, overseeing the company's theme parks, TV stations and film production.

Prior to that, he was the firm's COO and president of Comcast Cable, having signed a new contract in December of 2009. With that agreement came a cash bonus of $3 million for 2010, pushing his compensation total past that of Comcast CEO Brian Roberts. --J.O.

Source: Equilar, Inc.


Methodology: Total compensation is calculated as the sum of base salary, discretionary and performance-based cash bonuses, the grant-date fair value for stock and option awards during the fiscal year, and other compensation like earnings on deferred compensation, benefits and perks. Equilar, an executive compensation research firm, looked at CEOs at 1,000 of the largest public U.S. companies as measured by revenue. Pay data based on companies' fiscal year end of Dec. 2010 unless otherwise noted. Cash compensation and stock and options increases may not add up exactly to total compensation increases due to rounding.
By Stacy Cowley and James O'Toole @CNNMoney - Last updated January 06 2012: 5:23 PM ET
Join the Conversation
Tech's highest-paid executives

You don't have to work at Oracle or Apple to be among the top-paid executives in the technology industry, but it helps.

Most Popular


Most stock quote data provided by BATS. Market indices are shown in real time, except for the DJIA, which is delayed by two minutes. All times are ET. Disclaimer. Morningstar: © 2018 Morningstar, Inc. All Rights Reserved. Factset: FactSet Research Systems Inc. 2018. All rights reserved. Chicago Mercantile Association: Certain market data is the property of Chicago Mercantile Exchange Inc. and its licensors. All rights reserved. Dow Jones: The Dow Jones branded indices are proprietary to and are calculated, distributed and marketed by DJI Opco, a subsidiary of S&P Dow Jones Indices LLC and have been licensed for use to S&P Opco, LLC and CNN. Standard & Poor's and S&P are registered trademarks of Standard & Poor's Financial Services LLC and Dow Jones is a registered trademark of Dow Jones Trademark Holdings LLC. All content of the Dow Jones branded indices © S&P Dow Jones Indices LLC 2018 and/or its affiliates.