Find your top companies
Video (1 of 4)
-


 A look inside the retail giant, the No. 1 company on the Fortune 500 list - from salaries to its biggest-selling product. Watch


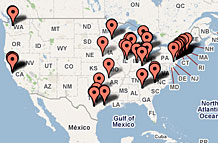
| Rank # of Fortune 500 Companies | |
|---|---|
| Texas | 58 |
| New York | 55 |
| California | 52 |
| Company | Rank |
|---|---|
| Valero Energy | 16 |
| Goldman Sachs | 20 |
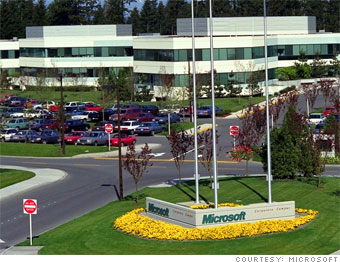
| Microsoft | 44 |
FAQ and methodology
Included in the survey are U.S. incorporated companies filing financial statements with a government agency. This includes private companies... More