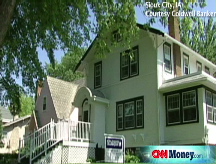
Existing home sales sink again
Sales of homes by homeowners dropped in August as prices decline by 9.5% from a year earlier.
NEW YORK (CNNMoney.com) -- Sales of existing homes fell in August, according to the latest reading on the battered housing market released Wednesday by an industry trade group.
The National Association of Realtors reported that sales by homeowners sank in August to an annual pace of 4.91 million, down 2.2% from the revised July reading of 5.02 million. It was the ninth month in a year in which the sales pace fell.
August sales were down 10.7% from a year earlier.
Economists surveyed by Briefing.com expected the report to show existing home sales slowed to an annual pace of 4.93 million.
"Home sales will be constrained without a freer flow of credit into the mortgage market," said NAR chief economist Lawrence Yun. "The faster that happens, the sooner we'll see a broad stabilization in home prices that in turn will help the economy recover."
Home prices continue to decline as mortgage lending has been constrained amid the credit crisis. Some economists say the proposed $700 billion bailout package would help free up credit, allowing lenders to refinance loans of troubled borrowers.
Meanwhile, the median price of a home sold during the month - including single-family homes, townhomes, condominiums and co-ops - fell 9.5% to $203,100 from $224,400 a year ago. Before the start of the current housing slump, it had been 11 years since prices fell on a year-over-year basis.
The median price of a single-family home fell 9.7% from a year ago to $201,900. The trade group has tracked those sales prices going back to 1989.
The rate of existing home sales actually rose 0.5% in the South and 0.9% in the Midwest on a seasonally adjusted basis.
Sales in the Northeast fell 6.6%, and sales in the West dropped 5.3%. The West saw the largest decrease in sales, even as prices fell a whopping 23.9% from last year in that region.
Home prices fell in every region of the country. In the Northeast, prices declined 3.8% year-over-year, while the South saw a dip of 3.4%. Prices fell by 5.6% in the Midwest.
But even as sales dropped, the excess supply of homes on the market also fell a bit in August. Realtors estimated that there were 4.26 million homes available for sale, which represented an 10.4 month supply. That was down from the 10.9 month supply in July. ![]()


