Americans keep tighter grip on cash
More signs of economic trouble: Personal spending drops for 5th straight month. Personal income sinks. Orders for big-ticket items also fall.
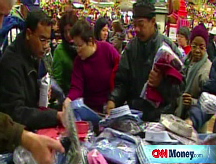
NEW YORK (CNNMoney.com) -- In a troubling sign that consumers are retrenching this holiday season, consumer spending and orders for durable goods fell further in November, according to government reports released Wednesday.
A Commerce Department report showed spending by individuals fell 0.6% last month, after falling 1% in October. It was the fifth consecutive monthly decrease. Economists surveyed by Briefing.com had forecast a 0.8% drop.
Falling consumer prices contributed heavily to the decline in overall spending. When prices were not taken into account, spending actually rose by 0.6%.
The so-called core PCE deflator rose by just 1.0% in the past 12 months, down from 2% by that measure in October. The key reading, which measures prices paid by consumers for goods and services other than food and energy, echoes a Labor Department report released last week that showed consumer prices fell by a record amount for the second straight month.
Still, declining overall spending is a worrisome sign for the holiday shopping season. It's particularly troubling for the economy, because consumer spending accounts for more than two-thirds of the nation's gross domestic product.
Spending declined as a separate report released by the Census Bureau showed orders for durable manufactured goods declined a seasonally adjusted 1% to $1.9 billion in November. Last month's decline was narrower than the revised 8.4% drop in October and the 3.1% drop forecast by economists.
In an encouraging sign, nondefense, nonaircraft capital goods - considered a proxy for business spending - actually rose 4.7%, following three consecutive decreases.
Inventories of manufactured durable goods, up 16 of the last 17 months, increased $1.6 billion or 0.5%. This is the highest level since the Commerce Department began tracking that measure in 1992, according to the report.
But the Commerce Department report actually showed spending on durable goods rose 0.6% in November after a 4% decline on that basis in the previous month.
Durable orders measures the dollar volume of orders, shipments and unfilled orders of goods built to last three years or more. The report is viewed as an indicator of manufacturing activity.
The Commerce Department reported personal income fell 0.2% in November, following a 0.1% rise in the previous month. Economists had forecast no change.
The rise in personal income far outpaced the change in prices, however, leading to a 1% rise in real income in the period. That's more than the revised 0.7% rise in that measure in October and the biggest increase since September 2005.
Because income fell less than spending, consumers posted a savings rate of 2.8% in the month compared with 2.4% in October. That means the average household saved $2.80 on every $100 of after-tax income.
In an attempt to jump-start consumer spending, President-elect Barack Obama's economic team and congressional staffers said Tuesday they are close to finalizing a massive recovery proposal.
Some economists estimate the price of such a package could go as high as nearly $800 billion. But the last stimulus package only provided a short-term boost to the economy in the second quarter.
All news is bad news in real estate right now. Have you recently bought a house anyway? Send your story and photos to realstories@cnnmoney.com and you could be featured in an upcoming article. ![]()


