Homes: Almost 20% cheaper

S&P/Case-Shiller index reports huge decline of 19.1% for the first quarter.

EMAIL  |   PRINT  |   SHARE  |   RSS
 
google my aol my msn my yahoo! netvibes
Paste this link into your favorite RSS desktop reader
See all CNNMoney.com RSS FEEDS (close)
By Les Christie, CNNMoney.com staff writer

For Money's upcoming Best Places to Live list, we'd like to know: What's most important to you when choosing where to live?
  • Good jobs
  • Affordable homes
  • Top schools
  • Low crime
  • Things to do
chart_home_prices_2.gif
S&P/Case-Shiller 20-city home price index
Metro area 1-year change (%)
Phoenix -36.0%
Las Vegas -31.2%
San Francisco -30.1%
Miami -28.7%
Detroit -25.7%
Minneapolis -23.3%
Tampa -22.4%
Los Angeles -22.3%
San Diego -22.0%
Chicago -18.6%
Washington -18.4%
Seattle -16.4%
Atlanta -15.7%
Portland -15.3%
New York -11.8%
Charlotte -9.3%
Cleveland -9.0%
Boston -8.0%
Dallas -5.6%
Denver -5.5%
Composite-20 -18.7%
Source:S&P/Case-Shiller
Mortgage Rates
30 yr fixed 3.80%
15 yr fixed 3.20%
5/1 ARM 3.84%
30 yr refi 3.82%
15 yr refi 3.20%

Find personalized rates:
 

Rates provided by Bankrate.com.

NEW YORK (CNNMoney.com) -- The home price slide accelerated during the first three months of 2009, according to a report issued Tuesday.

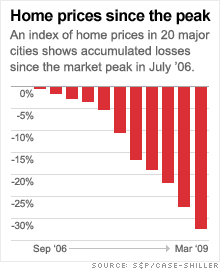
The S&P/Case-Shiller National Home Price index, a bellwether of real-estate market direction, plunged a record 19.1% during the quarter compared with the first three months of 2008. That followed an 18.2% drop last quarter.

The Case-Shiller 20-city index dropped 18.7% year-over-year, also a record. It fell 18.5% during the last three months of 2008. This index has plummeted 32.2% from its July 2006 peak and has fallen 32 straight months.

The national index covers almost all homes sold throughout the United States and is reported quarterly, while the 20-city index reports sales in 20 major metro areas and represents a cross section of the national market. The 20-city index comes out every month.

"Declines in residential real estate continued at a steady pace into March," said David Blitzer, chairman of the Index Committee at Standard & Poor's in a prepared statement. "All 20 metro areas are still showing negative annual rates of change in average home prices with nine of the metro areas having record annual declines."

The ugly report was somewhat unexpected, according to Mike Larson, a real estate analyst for Weiss Research.

"The market was anticipating better results," he said. "There had been some signs of increased sales in post-bubble markets."

But that sales increase has not translated into higher prices. Bargain hunting - bottom fishing really - for foreclosures and other distressed properties has driven sales volume up while further depressing prices.

The foreclosure sales, which many appraisers used to ignore when they evaluated home prices because they represented outliers rather than typical sales, now have to be accounted for.

"These used to be anomalies," said Larson. "Now, when sales are dominated by foreclosures, where they represent 50% or more of [transactions], they are the market."

The market plague has burst far beyond its Sun Belt epicenter, as the latest month's data reveals. In March, Minneapolis recorded the largest monthly price loss of any metro area in the 20-city index, losing 6.1% compared with February. That is the biggest single-month decline for a city in index history.

Sun-Belt cities still had the largest year-over-year declines in March, with Phoenix prices down 36%, Las Vegas off 31.2% and San Francisco dropping 30.1%.

Two cities have now have fallen more than 50% from their peak prices: Phoenix is down 53% since June 2006 and Las Vegas is off 50.4% from its August 2006 high. Dallas prices suffered the smallest loss from peak, just 11.1% since June 2007.

Economist Mark Zandi, the founder of Moody's Economy.com, is optimistic that the market will stop falling sometime this summer or fall. "We need to focus on the mortgage-modification program," he said. "If that plan doesn't work or only works as well as the other modification programs have, we've got a problem." To top of page

Find mortgage rates in your area


Features
They're hiring!These Fortune 100 employers have at least 350 openings each. What are they looking for in a new hire? More
If the Fortune 500 were a country...It would be the world's second-biggest economy. See how big companies' sales stack up against GDP over the past decade. More
Sponsored By:
More Galleries
10 of the most luxurious airline amenity kits When it comes to in-flight pampering, the amenity kits offered by these 10 airlines are the ultimate in luxury More
7 startups that want to improve your mental health From a text therapy platform to apps that push you reminders to breathe, these self-care startups offer help on a daily basis or in times of need. More
5 radical technologies that will change how you get to work From Uber's flying cars to the Hyperloop, these are some of the neatest transportation concepts in the works today. More
Worry about the hackers you don't know 
Crime syndicates and government organizations pose a much greater cyber threat than renegade hacker groups like Anonymous. Play
GE CEO: Bringing jobs back to the U.S. 
Jeff Immelt says the U.S. is a cost competitive market for advanced manufacturing and that GE is bringing jobs back from Mexico. Play
Hamster wheel and wedgie-powered transit 
Red Bull Creation challenges hackers and engineers to invent new modes of transportation. Play

Most stock quote data provided by BATS. Market indices are shown in real time, except for the DJIA, which is delayed by two minutes. All times are ET. Disclaimer. Morningstar: © 2018 Morningstar, Inc. All Rights Reserved. Factset: FactSet Research Systems Inc. 2018. All rights reserved. Chicago Mercantile Association: Certain market data is the property of Chicago Mercantile Exchange Inc. and its licensors. All rights reserved. Dow Jones: The Dow Jones branded indices are proprietary to and are calculated, distributed and marketed by DJI Opco, a subsidiary of S&P Dow Jones Indices LLC and have been licensed for use to S&P Opco, LLC and CNN. Standard & Poor's and S&P are registered trademarks of Standard & Poor's Financial Services LLC and Dow Jones is a registered trademark of Dow Jones Trademark Holdings LLC. All content of the Dow Jones branded indices © S&P Dow Jones Indices LLC 2018 and/or its affiliates.