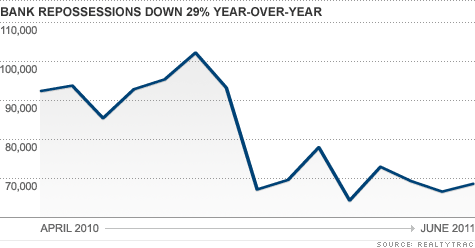
NEW YORK (CNNMoney) -- Foreclosures declined in more than 84% of U.S. metro areas during the first half of the year, according to the latest report from RealtyTrac, an online marketer of foreclosed properties. But that doesn't mean these markets are staging a turnaround.
"These dramatic decreases indicate the foreclosure pipeline continues to be clogged in many local markets across the country," said RealtyTrac CEO, James Saccacio, whose firm reported earlier this month that the national foreclosure rate fell 29% over the past 12 months.
Much of that backlog, he explained, is due to a glut of already-foreclosed properties that the banks are having a hard time selling and to the slowdown in the processing of foreclosures following the "robo-signing scandal" of 2010.
As a result of the scandal, in which the banks were accused of mishandling paperwork and failing to follow proper protocols, banks are being much more careful and many filings have been delayed.
The biggest decline in the number of foreclosures have come in judicial foreclosure states where defaults go through the courts and paperwork is scrutinized by judges.
The RealtyTrac metro area report, according to RealtyTrac spokesman Rick Sharga, shows -- on a localized level -- just how significant the declines have been in some judicial states.
Before the scandal, Florida claimed nine of the top 20 metro areas with the highest foreclosure rates during the first half of 2010. This year, there's only one, Cape Coral, which recorded 52% fewer foreclosures compared with the same period in 2010.
Las Vegas -- ground zero for mortgage defaults the past few years -- continues to get bombarded with the highest rate of foreclosure filings in the land.
One in every 19 homes in Sin City and the surrounding area got plastered with a foreclosure filing -- either a notice of default, a notice of sale or bank repossession -- during the first half of 2011. That was six times the national rate, according to RealtyTrac.
According to recent analysis by Standard and Poor's, the financial services company, which examined RealtyTrac's metro area foreclosure data against price changes for the 20 cities in the S&P/Case-Shiller home price index, trends in home prices and foreclosures are closely tied.
"When compared to the peak-to-trough price declines for each of the 20 cities, prices drops and foreclosure events are correlated at 87%," said David Blitzer, S&P's chairman of index committees.
Typically, that would mean a drop in foreclosures would have a positive impact on home prices, explained Sharga. But not this time.
"There is enough of a backlog of distressed inventory that there will be little or no short-term benefit," he said.
Even if the banks repossess fewer homes, they already own so many they're trying to sell, that supplies will not tighten appreciably.
The slowdown in foreclosure processing could help some borrowers buy extra time to regain their financial footing and coax a mortgage modification out of their bank. Also, said Sharga, more short sales could be approved, which can help preserve home values better than foreclosures.
"In the long term, though," said Sharga, "delaying foreclosures will just prolong the problem."
If that happens, home values could bounce around the bottom for years, contributing little to the faltering national economic recovery. ![]()
| Overnight Avg Rate | Latest | Change | Last Week |
|---|---|---|---|
| 30 yr fixed | 3.80% | 3.88% | |
| 15 yr fixed | 3.20% | 3.23% | |
| 5/1 ARM | 3.84% | 3.88% | |
| 30 yr refi | 3.82% | 3.93% | |
| 15 yr refi | 3.20% | 3.23% |
Today's featured rates: