Stagnant incomes, higher home prices and climbing mortgage rates made affording a home a lot more difficult for the average homebuyer during the second quarter.
Of all homes sold between April and June, 69.3% were affordable to a family earning the median income of $64,400, according to an index compiled by the National Association of Home Builders (NAHB) and Wells Fargo. That's down significantly from the first quarter, when 73.7% of homes sold were affordable and from late 2011, when affordability peaked at 78%.
"Housing affordability has been hovering near historic highs for the past several years, largely due to exceptionally favorable mortgage rates and low prices during the recession," said NAHB Chairman Rick Judson, a home builder from Charlotte, N.C.
Related: America's Best Places to Live
But all of that is starting to change now that both home prices and rates have been on the rise. The median price of all new and existing homes sold during the second quarter was $202,000 during the second quarter, up 9.2% from $185,000 a year earlier, NAHB/Wells Fargo reported. Meanwhile, interest rates for 30-year fixed-rate mortgages averaged 3.99% over the three month period, compared with 3.68% in the second quarter of 2012.
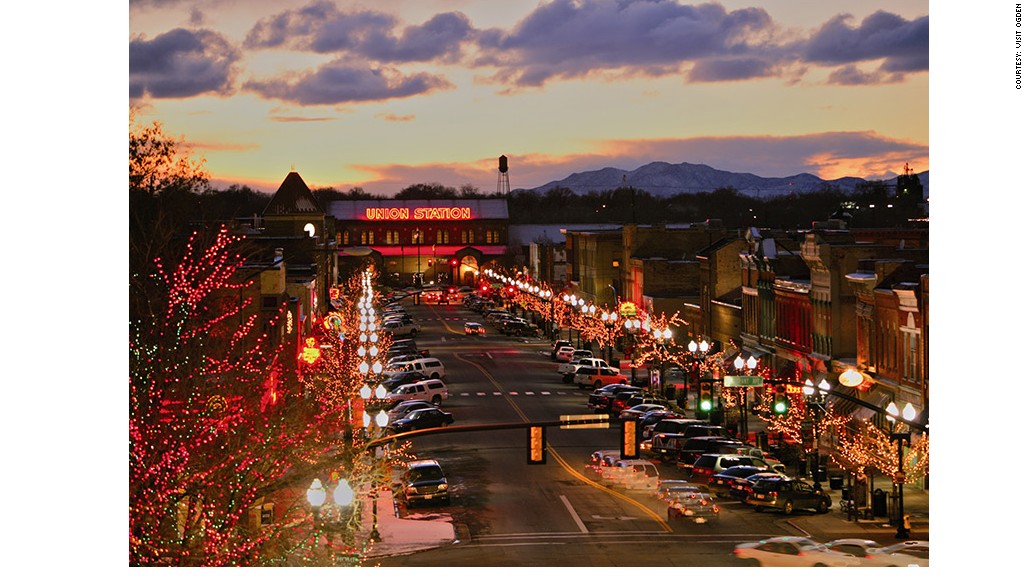
The Ogden, Utah, metro area was the nation's most affordable major housing market. Residents earning the area's median income of $70,800 were able to afford 92.8% of homes sold there during the quarter. It was the fourth consecutive quarter that Ogden led the nation.
Related: Best Places to Live: Most affordable markets
Indianapolis finished right behind Ogden with a 91.8% affordability rating. Others in the top five most affordable markets included Harrisburg, Pa., Youngstown, Ohio, and Buffalo, N.Y.
San Francisco was the least affordable metro area, where the average family could only afford 19.3% of homes, even though the median income there was a hefty $101,200.
Los Angeles, Santa Ana, Calif., New York, and San Jose rounded out the top five unaffordable major cities.
This is the first time the housing affordability index has fallen below 70% since 2008, the report said. When compared to the bubble years, housing is still considered a bargain, however. At one point in 2006, only about 40% of homes sold were affordable.
The most (and least) affordable housing markets
City | Median home price | Median family income | % of homes that are affordable |
|---|---|---|---|
Most affordable markets | |||
Ogden, Utah | $153,000 | $70,800 | 92.3% |
Indianapolis | $116,000 | $65,100 | 91.8% |
Harrisburg, Pa. | $152,000 | $70,800 | 91.4% |
Youngstown, Ohio | $75,000 | $53,900 | 90.9% |
Buffalo, N.Y. | $105,000 | $63,500 | 90.7% |
Least affordable markets | |||
San Francisco, Calif. | $781,000 | $101,200 | 19.3% |
Los Angeles | $407,000 | $61,900 | 28.3% |
Santa Ana, Calif. | $535,000 | $84,100 | 28.8% |
New York | $435,000 | $66,000 | 29.8% |
San Jose, Calif. | $640,000 | $101,300 | 32.2% |


