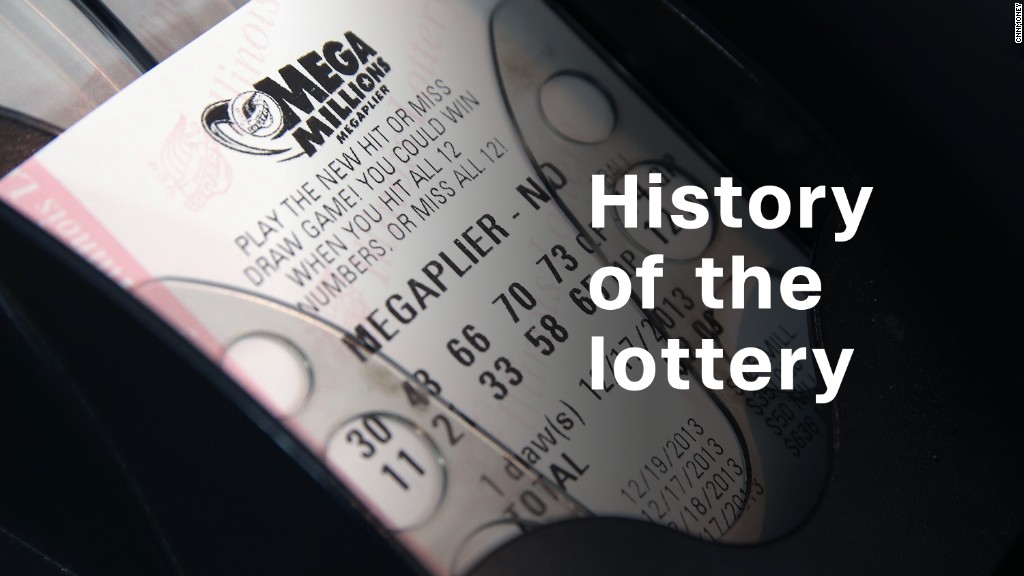
If it seems like everyone is running out to buy lottery tickets this week, you're about half right.
According to a June 2017 survey conducted by Gallup, 49% of U.S. adults reported buying lottery tickets making it by far the most popular form of gambling in the United States.
The general belief is that poorer Americans buy lottery tickets more often than wealthier ones. But that's not quite true.
The survey showed the most frequent lottery players earn between $36,000 and $89,999. About 56% of that group bought tickets in the last year. Fewer of those making under $36,000 bought tickets, only 40%. About 53% who make above $90,000 bought a ticket.
But other studies have shown that when lower income players do buy tickets, they spend far more money on lottery tickets than wealthier players.
A study published in the Journal of Gambling Studies found that those in the bottom fifth of income spent the most on lottery tickets, and more than twice as much as the richest lottery players - $433 a year vs. $193 a year.
Related: What are your odds of winning Powerball or Mega Millions
The poorer lottery players also buy far more of the lower prize games, such as scratch-off instant games which account for the majority of lottery sales.
The richer buyers are buying the multi-state jackpot games such as Powerball and Mega Millions. And the wealthier players are likely to be drawn in by the big jackpot prizes like those being offered right now by both Powerball and Mega Millions.
"There's very clear evidence, as jackpots rise, there's a different group of people who are buying lottery tickets," said Victor Matheson, a professor at the College of Holy Cross and an expert on gambling. "While $1,000 prize on a scratch off game isn't going to be life changing to a wealthier player, a $500 million prize is real money for almost everyone in the United States."
Related: What tax reform means for the next big lottery winner
According to multiple surveys, men are more likely to buy tickets than women, and whites are also the most likely to buy tickets, though blacks spend more on tickets on average.
Census data on 2015 lottery ticket sales by state show that Massachusetts sells the most tickets per capita, an average of $735 per person in the state, according to analysis of the data by LendEDU. Neighboring Rhode Island is No. 2 with an average of $516. North Dakota sells the least per person, an average of only $34, followed by Oklahoma, which sells only $44 per resident, on average.
Younger people buy lottery tickets far more often than older people. The study in the Journal of Gambling Studies found that 69% of those age 31 to 40 bought lottery tickets, followed closely by 66% of those age 18 to 29. Those who are age 61 and older are the least likely to buy tickets at 54%.
