Our annual ranking of America's largest corporations

27 of 500
BACKNEXT
27. Procter & Gamble
Procter & Gamble
Financials: Latest Results
Rank: 27 (Previous rank: 26)
CEO: Robert A. McDonald
Was this company a 2011 top stock?

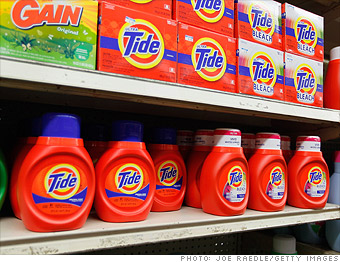
As the cost of materials and fuel continues to rise, many American consumers have kept to cautious spending even as the economy recovers. The continued belt-tightening spells somewhat glum times for consumer goods giant Procter & Gamble. The company announced in February 2012 it would cut 5,700 jobs -- a whopping 10% of its non-manufacturing workforce -- as part of a larger plan to trim $10 billion in expenses by 2016. The company has also raised product prices to counter rising costs, and it announced that it will sell its Pringles business to Kellogg for just under $2.7 billion. Despite the challenges, sales and profits were up for the company at the end of 2011 compared to the previous year.

Subscribe to Fortune Magazine
Key financials $ millions % change
from 2010
Revenues 82,559.0 3.6
Profits 11,797.0 -7.4
Assets 138,354.0
Stockholders' equity 67,640.0
Market value (3/29/2012) 184,572.3
Profits as % of  
Revenues 14.3
Assets 8.5
Stockholders' equity 17.4
Earnings per share  
2011 $ 3.93
% change from 2010 -4.4
2001-2011 annual growth rate % 14.3
Total return to investors %
2011 7.1
2001-2011 annual rate 7.9
Rank Company 500
rank
Revenues
($ millions)
1 Procter & Gamble 27 82,559.0
2 Kimberly-Clark 137 20,846.0
3 Colgate-Palmolive 155 16,734.0
4 Avon Products 234 11,291.6
5 Estée Lauder 290 8,810.0
6 Clorox 456 5,326.0
Issue date: May 21, 2012
Figures are for fiscal year ended June 30, 2011.
Galleries and more
Headquarters
MAPS
Procter & Gamble
1 Procter & Gamble Plaza
Cincinnati, OH 45202
513-983-1100
www.pg.com
What do you think about Procter & Gamble?
Video
Fortune 500+
Want more on America's top companies? Get data on the full Fortune 1,000 list here. Fortune 500+

Rank # of Fortune 500 Companies
California 53
Texas 52
New York 50
Company Rank
Google 73
NetApp 474
NuStar Energy 377
Company 2011 $ (millions)
Exxon $41,060.0
Chevron $26,895.0
Apple $25,922.0
FAQ and methodology
Included in the survey are U.S. incorporated companies filing financial statements with a government agency. This includes private companies... More
Current Issue
  • Give the gift of Fortune
  • Get the Fortune app
  • Subscribe

Most stock quote data provided by BATS. Market indices are shown in real time, except for the DJIA, which is delayed by two minutes. All times are ET. Disclaimer. Morningstar: © 2018 Morningstar, Inc. All Rights Reserved. Factset: FactSet Research Systems Inc. 2018. All rights reserved. Chicago Mercantile Association: Certain market data is the property of Chicago Mercantile Exchange Inc. and its licensors. All rights reserved. Dow Jones: The Dow Jones branded indices are proprietary to and are calculated, distributed and marketed by DJI Opco, a subsidiary of S&P Dow Jones Indices LLC and have been licensed for use to S&P Opco, LLC and CNN. Standard & Poor's and S&P are registered trademarks of Standard & Poor's Financial Services LLC and Dow Jones is a registered trademark of Dow Jones Trademark Holdings LLC. All content of the Dow Jones branded indices © S&P Dow Jones Indices LLC 2018 and/or its affiliates.