CNNMoney spoke with experts, including the American Psychological Association, to come up with 15 of the biggest indicators of stress in urban areas. Using statistics from government and non-profit sources, CNNMoney then collected data for 55 metro areas and divisions with populations of 1 million or more.
The factors for each major metro area and division were then broken up into five categories: the economy and money, work, family, lifestyle and crime. All factors were normalized, grouped into categories, weighted and then added together to create an overall ranking.
To make sure we were using statistically comparable government data, we used metro area and division borders as determined by the U.S. Office of Management and Budget prior to 2013. So unless otherwise indicated, all government data is as of 2012 for metropolitan statistical areas with populations of 1 million or more. In all categories, the most recent applicable data was used.
Poverty rates are from the U.S. Census Bureau.
Unemployment rates (non-seasonally adjusted) are as of February 2014 from the Department of Labor. For Boston and Providence, we used data for the corresponding New England City and Town Areas, the only boundaries for which regional unemployment data was available.
Cost of living data is from the Center for Regional Economic Competitiveness for 2013. For the Camden, N.J. metro division, we used a broader metropolitan statistical area for cost of living data that included Camden, Philadelphia and Wilmington, Del.
Mean commute times and hours worked from Census Bureau.
Commuter stress index data comes from the Texas A&M Transportation Institute for 2011. For metropolitan divisions, this data was for the overarching metro area.
See the full Stressed Out Cities list here
Health status, binge drinking, smoking and exercise data are from a 2011 Centers for Disease Control survey. For Rochester and Oakland, we used the prior year’s data.
The average percentage of sunshine (over a multi-year period) comes from the National Climatic Data Center. For Camden, Newark, Orlando, San Bernardino, San Jose and Santa Ana, data for the closest nearby city was used.
Average family size came from the Census Bureau, as did the percentage of the population who reported their marital status as divorced.
Murder/non-negligent manslaughter and property crime rates are from the 2011 Federal Bureau of Investigations Uniform Crime data. For Providence, R.I. we had to use a prior years’ data.
Feedback on the Most Stressed Out Cities list? Email the editors
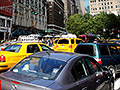
From gridlock to poverty to crime, residents in these cities have a lot to stress about.