CNNMoney.com > Small Business > Best Places to Launch
Fargo, ND
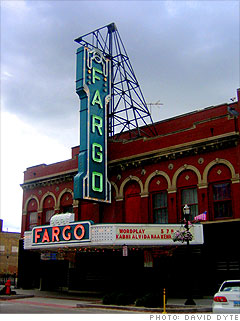
MSA: Fargo, ND-MN
Best places ranking: #3 among small metro areas Population: 195,685
Fargo is noted more for its rich farmland and the occasional flooding of the Red River than for being a high-tech hotbed. But that perception is slowly changing. The presence of a big Microsoft customer support center doesn't hurt, and Senator Byron Dorgan has actively promoted eastern North Dakota as a tech corridor -- an effort entrepreneurs say is paying off.
Local businesses cite North Dakota State University and easy air and road access to Minneapolis and other big cities as key local advantages. The University of North Dakota, 70 miles away, also contributes to the town's abundance of educated, motivated labor. An ongoing "Renaissance Zone" plan offers tax breaks and other incentives to business that invest in Fargo's historic downtown district. Like North Dakota in general, Fargo profited from the state's energy riches -- western North Dakota's oil and wind energy projects are taking off. The agriculture sector has also fed the area's relative prosperity. All of that leads to a pretty rosy employment picture: North Dakota, unlike most states, is actually hiring. -Barbara Darrow |
||||||||||||||||||||||||||||||||||||||||||||||||||||||||||||||
Launch Toolbox:
Resources for getting started in Fargo, ND

LEARNLocal startup resources
BORROWLocal smallbiz lenders
| ||||||||||||||||||||||||||||||||||||||||||||||||||||||||||||||
|
Fargo Business Statistics
|

"There are jobs -- agriculture stayed strong throughout the recession, and North Dakota is one of only two states not running a significant budget deficit." -Jeff Young
|
|||||||||||||||||||||||||||||||||||||||||||||||||||||||||||||
What do you think of Fargo?