NEW YORK (CNN/Money) � Just because stock indexes have been taking a beating doesn't mean your own 401(k) has sustained the same injuries.
That is the finding of mutual-fund companies Vanguard and Principal Financial Group. Each recently surveyed accounts in the 401(k) plans it provides companies and found that, on average, Americans aren't doing nearly as badly in their individual retirement portfolios as the market as a whole.

If some of your portfolio was in bonds or other conservative investments, and you were diligent about making regular contributions, your personal rate of return may have trumped the stock market's dismal performance.
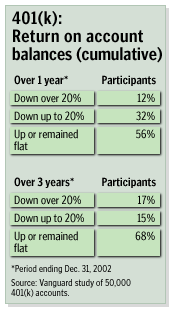
Does that mean you're not in the red? Doubtful. Seven out of 10 401(k) investors lost money during the past three years, according to Vanguard.
Still, plenty of us did better than the S&P 500, a typical benchmark for the stock market's performance. (Calculating your personal rate of return involves some taxing math. For help crunching the numbers, try our Rate of Return calculator.)
2002: Few beat back the beast
Take 2002, which was the worst of the three years in the bear market so far. The S&P 500 index fell 22.1 percent. But the typical participant in a 401(k) plan provided by Vanguard lost "only" 13.3 percent. And, that's a median return, meaning 50 percent of participants actually did better.

Why? Because most people, according to Vanguard's researchers, kept a balanced portfolio and made regular contributions throughout the market's decline.
Balanced means owning not only stocks but conservative investments such as bonds, stable value funds or money market funds. Vanguard looked at a random sample of 50,000 of its accounts, and found that the average asset allocation was 70 percent stocks, 30 percent fixed income.
Returns in 2002 were even better among 2 million participants in 401(k) plans provided by Principal Financial Group. The median decline there was only 6.5 percent.
That's probably because the investors in Principal's plans were even more conservatively invested than participant's Vanguard's 401(k) plans. In the fourth quarter of 2002, the distribution of assets across all Principal's 401(k) plans was 40 percent in equity funds and company stock; 33.2 percent in guaranteed stable value funds; 11.2 percent in bonds; 7.9 percent in the money market; 5.3 percent in asset allocation funds; and 2 percent in real estate.
Did you have a good bear market?
Over a three-year period (2000-2002), 401(k) investors again beat out the S&P, according to Vanguard. They saw a median decline of 6.3 percent a year while the index fell 14.6 percent a year.
During the five-year period ending Dec. 31, 2002 -- remember, that includes two years of the late, great bull market -- 401(k) participants saw a median annual gain of 0.2 percent while the S&P 500 slipped an average 0.6 percent a year.
One reason many 401(k) participants "beat" the market is due to good investing discipline. It's smart to contribute regularly and to have a balanced portfolio -- who hasn't thanked their lucky stars for their bond fund lately?

Since most 401(k) investors have been making ongoing contributions throughout the bear market, their account balances have remained steady. In other words, while your stock funds were sinking, your balance held up reasonably well because you were continually feeding it money.
In 2002, despite a median drop of 13.3 percent in investment return, the median account balance among Vanguard participants actually rose 1 percent over 2001 levels. So a $100,000 balance at the end of 2001 would have grown to $101,000 balance by the end of 2002.
For the three-year period, the median balance fell 2 percent, despite a median annual drop in investment return of 6.3 percent. In other words, if you had a $100,000 balance at the beginning of 2000, you would have had $98,000 at the end of last year.
Why bother? Here's why
These results may not leave you jumping for joy. After all, having the same account balance today as you did three years ago may cause you to think, "Oh, why did I bother making contributions?"
One good answer: it's better than having substantially less than you had three years ago. That's the situation you'd find yourself in if you had maintained your stock exposure but didn't contribute any new money. Planning for retirement doesn't just mean investment growth; you need to put away savings in order to have something that can grow.
Plus, if you've been buying into the down market, you've bought some shares on the cheap. Presumably, they'll be priced higher several years from now. So, by investing regularly during the downturns, you can benefit from the growth in share price during the upturns.

|

