NEW YORK (CNN/Money) -
Two things dumbfounded me on Monday.
The first was that the Nasdaq-100 Trust, also known as the Cubes for their ticker symbol QQQ, traded more than 60 million shares that day. Only Cisco was more active.
The second thing was that Madonna -- whose last book was called "Sex" -- signed a deal with Penguin to write children's stories.
Anyway, that's a rant for another time. Back to the Q's.
The QQQ is no longer synonymous with tech
The Q's have been a trendy investment ever since they debuted, as coincidence would have it, on March 10, 1999. Yup. Exactly a year to the day before the Nasdaq hit its peak of 5,048.62. Those were the days. Sigh.
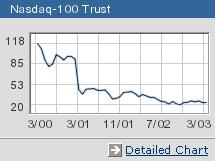
The Nasdaq-100 is widely viewed as a proxy for the technology sector since it is made up of the largest non-financial services companies trading on the Nasdaq. Not surprisingly then, the QQQ (QQQ: Research, Estimates) has performed even worse than the Nasdaq during the past three years. It is down a sickening 78.6 percent compared to the Nasdaq's almost as horrifying 74 percent loss.
| |
|
The Triple Q's have been a quagmire for investors since the tech bubble burst.
|
|
It's also true that the Nasdaq-100 is no longer as accurate a barometer of tech as it used to be. For the index's annual rebalancing last December, 15 companies were added and none of the additions were tech stocks -- eight tech stocks were removed.
As a result, less than half (49) of the stocks in the Nasdaq-100 are true tech and telecom stocks like Cisco (CSCO: Research, Estimates), Dell (DELL: Research, Estimates), Intel (INTC: Research, Estimates) and Microsoft (MSFT: Research, Estimates).
Other big names are retailers (Costco (COST: Research, Estimates), Bed Bath & Beyond (BBBY: Research, Estimates) and Starbucks (SBUX: Research, Estimates)) and biotechs (Amgen (AMGN: Research, Estimates) and Medimmune (MEDI: Research, Estimates)). Even Irish airline Ryanair (RYAAY: Research, Estimates) is in the index.
Such stocks could very well end up making the Q's less volatile, but that's not the point. If investors are buying the index for tech exposure, they should think again.
Instead, they are investing (speculating?) in a collection of big tech that isn't all that cheap. The 49 tech stocks are trading at an average of 38 times 2003 earnings estimates. The 51 non-techs trade at an average of 28 times estimates. But the earnings growth rates are nearly identical.
The non-techs are expected to post an average earnings increase at a 37 percent clip this year and 19 percent over the next few years. For the Nasdaq-100 techs, analysts are predicting earnings gains of 35 percent this year and 20 percent annually over the next three to five years. And if anything, these estimates might be too high.
Bob Straus, portfolio manager with Meridian Investment Management, which runs the Icon Information Technology fund, says that a more reasonable long-term growth rate for the technology sector is just below 15 percent.
Tech funds are better investments than the Cubes
Want one more reason why the Triple Q's seem to be a bad way to gamble on a tech recovery? A plethora of QQQ shares are being held short, i.e. investors are betting the price will fall. According to the Nasdaq, 203.7 million shares were being held short as of Feb. 14, up 22 percent from mid-January. That's nearly a third of the total number of QQQ shares available on the market, a pretty bearish sign indeed.
| �* Through 3/3/03 | | �Source:��Morningstar |
|
With all this in mind, I think that if investors still want to slowly dip their toes in the tech sector, then it is wiser to do so through a handful of actively managed tech funds with strong track records.
The Icon Information Technology fund is one of them, with a five-year annualized return of 6.7 percent, according to fund tracker Morningstar. (By way of comparison, the average tech fund has a five-year annualized loss of 6.2 percent.)
Some other tech funds with a strong track record over the past five years are the Fidelity Select Software and Computer and Fidelity Select Technology funds, the Pimco RCM Global Technology fund and the Dreyfus Premier Technology fund.
| Recently in Tech Investor
|

|
|
|
|
All of these funds have more of a focus on technology than the Cubes, so once businesses start to renew their spending on tech (although it's anybody's guess when that will finally happen), it stands to reason that they could have more upside than the Q's.
Now back to those Madonna books. Hopefully none of the characters will be wearing bullet bustiers.

|

