NEW YORK (CNN/Money) - The Tilt-A-Whirl has nothing on the global markets lately, where the speed with which traders have been shifting positions has been enough to make anybody's stomach spin.
One moment the war is going poorly, sending cash pouring into safe-haven assets, like government bonds and gold, jacking the price of oil higher, hammering stocks and the U.S. dollar. The next, the war is going well again, and all these "war trades" that have been put on get suddenly unwound. With traders running from one side of the boat to the other, one can hardly say that global markets are on an even keel.
Making matters even worse, the traders in different markets are all taking cues from one another, creating a magnifying effect on each move. Oil goes up so stocks go down so bonds go higher so oil goes up some more.
"It shows you that everything is trading-desk oriented," said Mizuho Securities USA strategist John Vail. "They tend to move in packs."
This behavior, where everything trades so cleanly with (or against) everything else, has rarely been so pronounced. The 10-year Treasury note and stocks, for instance, are negatively correlated (when stocks go up, the 10-year goes down, and vice versa) to the strongest degree of the past seven years.
"This sloshing back and forth between Treasurys and stocks happens whenever there's a panic," said Brian Reynolds, fixed income and economic strategist at Kirlin Securities.
Risky business
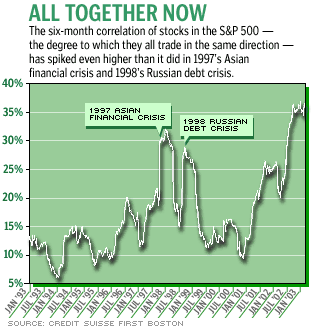
Within the stock market, the pack-like behavior is even more pronounced. An analysis by Credit Suisse First Boston equity derivatives analyst Mika Toikka, shows that the degree to which stocks are moving in unison is at its highest level since the stock market crash of 1987. It's a sign, according to Toikka, that the stock market is single-mindedly focused on risk, with little regard to the fundamentals.
A quick look through recent history shows that such spikes in the correlation of individual stocks' moves with one another have often come at important stock market bottoms -- not just during the 1987 stock market crash, but during the deep market downdrafts that came with the Asian financial crisis in the fall of 1997 and the Russian debt crisis that came in the fall of 1998.

But don't start writing buy tickets just yet.
What the market drops in 1987, 1997 and 1998 have in common is not just that they were swell times to load up on stocks, but that they represented big breaks between the fundamentals and traders' perceptions. The reality was that the world, the economy and companies' earnings prospects were nowhere near as bad as Wall Street feared. When the crisis passed, the truth of the situation was hammered home, and huge snap-back rallies ensued.
But if there is a sharp break now between what traders are doing and the fundamentals of the market, thinks Merrill Lynch chief U.S. strategist Rich Bernstein, its character is different this time.
Stocks have been volatile lately, but they've mostly rallied on the perception that the war in Iraq will be over quickly, removing heaps of uncertainty from the world and ushering in a new bull market. In the past month, the S&P 500 has risen more than 5 percent.
Meantime, there have been reams of lousy economic data. Increasingly, it appears that the U.S. economy contracted in February and March, raising the possibility that the country has slid back into recession. Profits expectations are getting steadily trimmed. But these things have been ignored because everybody wants to be in the market when peace breaks out. In the past when everyone was trading in a pack, the big fear on Wall Street was losing your shirt.
"Now the overwhelming fear among portfolio managers is being left behind," said Bernstein.

|

