NEW YORK (CNN/Money) -
With the U.S. economy's future so unclear that even Alan Greenspan isn't making predictions, it might be tempting to pay more and more attention to earlier and earlier economic reports, looking for any hint of clarity.
But some analysts warn that a little patience might be in order.
Greenspan and his compadres at the Federal Reserve have complained for several months about uncertainty surrounding the war in Iraq and chose at their January policy meeting not to handicap the risks to the economy.

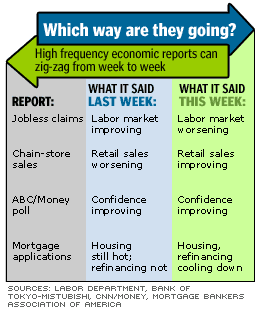
Perhaps for this reason, now that the war in Iraq is mostly over, attention has increasingly turned to "high-frequency" economic data -- such as weekly jobless claims, chain-store sales and the earliest of consumer confidence and manufacturing surveys -- for a hint of the economy's direction.
But some of these data, particularly the weekly reports, are notoriously volatile and could contribute to some volatility in U.S. stock markets, if traders end up following them too closely.
"Everybody's looking for every single data point that can possibly give them an edge in their analysis," said Hugh Johnson, chief investment officer at First Albany. "I've seen folks put together a ratio of stock prices to weekly jobless claims, suggesting it's a leading indicator. That's preposterous, but there's an urge to move in that direction, to find every leading indicator you can get every day."
Take consumer confidence, for example. Typically, the monthly confidence survey by the Conference Board, a private research firm, is the most-respected gauge of how consumers, whose spending fuels more than two-thirds of the economy, are feeling.
The Conference Board surveys 5,000 households, a pretty broad sample. The University of Michigan's sentiment survey is more up-to-date, coming out first in mid-month and then updated at the end of the month with fresh survey results. But it's also got a much smaller sample size of 500 households.
Lately, amid rampant uncertainty, a new darling among confidence watchers is a survey by ABC News and Money magazine -- the same magazine for which this site is named -- that comes out every week. After all, why wait for a whole month for confidence data, when you can get it every week?
| Related stories
|

|
|
|
|
Well, for one thing, the more-frequent report could also be less reliable -- the ABC/Money poll surveys only about 250 people every week, and some economists worry that's not enough of a sample size.
"These surveys tend to be media responsive, moving according to however the news is going," said Charles Blood, director of financial markets and economic analysis at Brown Brothers Harriman. "If you're trying to get true insight, it's not clear that's at all helpful."
Another rising star on the econ-data circuit is the Empire State Survey, the New York Fed's monthly index of purchasing manager confidence in the manufacturing sector.
The Empire State's popularity hinges on the fact that it comes out a few days before the more established Philadelphia Fed index of mid-Atlantic region manufacturing, which comes out before the Chicagoland index, which comes out before the Institute for Supply Management index of national manufacturing.
It's a preview to a preview to a preview, in other words -- and it might be totally useless.
"These surveys give regional snapshots, and that's all they do," said Prudential Financial market analyst Larry Wachtel, who isn't sure these numbers are popular enough yet to move the market significantly. "I'd never even heard of the Empire State survey until recently -- and I don't think you can build the case that Wall Street sits there panting, waiting for the results."
Still, some economists think that, as long as people ingest these data calmly, maybe with a grain of salt for flavor, they could offer clues to the economy's general health.
For example, weekly claims for unemployment benefits have swung up and down in the past few weeks, going from 443,000 in the last week of March to 412,000 in the April 5 week to 442,000 in the April 12 week.
Regardless of the volatility, however, these numbers all have one thing in common -- they're all solidly above 400,000, the benchmark level many economists say demonstrates a sickly labor market.
"The weekly claims number is as good an indicator as there is; we watch weekly chain-store sales numbers for clues on retail sales; and the confidence numbers have not correlated with spending by any mans, but they have captured the spirit of the economy in the past couple of months," said UBS Warburg economist Jim O'Sullivan.
"There's certainly some value in reading these numbers as they're coming in."

|

