NEW YORK (CNN/Money) - You'd be hard pressed to throw a knife on Wall Street without having it stick into somebody who thinks the market is going to be stuck in a range.
Paw through the financial press, flip on the TV and you'll find chatter about how the market is not going anywhere for months and years to come. Stocks have fallen to the point where valuations seem at least somewhat reasonable, but the halting economy has stifled profit growth. The result is that investors have been left with little impetus to buy or to sell.
"Almost everywhere we turn these days, we hear that the market is expected to be range bound," wrote Credit Suisse First Boston quantitative and equity derivative strategist Steve Kim in a recent note. "In fact, this is our expectation as well. Such strong consensus worries us."
In the investing world, strongly held opinions aren't just beliefs, they're bets. Lately, bets that the market will move sideways have been good ones. Since July, the S&P 500 has been bouncing in a range between 800 or so and 950 or so. Traders who have had the acumen to play in that range, buying at its bottom, short-selling near its top, have made good coin.

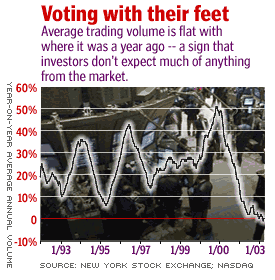
Meanwhile longer-term investors have recognized that they have less opportunity to make money while the market remains mired. Trading volume, which tends to rise over time, has flagged. Over the past year the number of shares that changed hands on the New York Stock Exchange and the Nasdaq Stock Market ran dead even with the previous year's volume.
Roll up the herd and cut out the stray ones
So what's Kim worried about? The problem with strongly held beliefs on Wall Street, is that they can end up being the equivalent of a boatload of people going over to the port side. As the boat threatens to founder, they're all forced to scramble for starboard. Typically such problems occur when everybody is excessively bullish or excessive bearish. When the market is overly optimistic, for instance, nearly all the potential good news there could possibly be is priced into the market. Bad news, however, comes as a shock, making the market vulnerable to a slide.
Now, however, investors may be excessively neutral in their outlooks, believing that the market will never break out of its range. The S&P is nearing the top of its range, and the consensus on Wall Street is that it's set for a fall. Such a dynamic suggests to Kim that, absent another bout of bad news, stocks could break higher.
It isn't just that many investors believe the market is confined. It's their apparent willingness to bet on it that increases the potential for a jump.
"A lot of people think the market is going to be stuck, including some very big hedge funds," said Phil Ruffat, director at Mizuho Securities USA's futures division.
As a result, he's seen an increase in the number of investors employing an options strategy called a "short strangle" where an investor will sell a put (a bet that the market will go lower), and a call (a bet that it will go higher) on, say, the S&P 100 index. If the S&P 100 doesn't break below the put's strike price, or above the call's strike, the strangle pays off.
But if the S&P 100 breaks higher, the strangle can go badly awry. The call obliges its seller to provide the S&P 100 to the buyer at its strike price, no matter what. The seller must either buy the call back (at a much higher price than he sold it for) or buy the S&P 100 to provide to the call buyer. Either action can, in itself push the market higher.
The potential for the short strangle to go wrong has been increasing, as investors place ever more aggressive bets against the market making any headway. With so many players looking to sell puts and calls, options prices have come down markedly -- the Chicago Board Options Exchange's Volatility Index, or Vix, which is based on the cost of options on the S&P 100 index, has fallen to its lowest level since last June.
Dreadful sorry, Clementine
Outside of the options arena, other investors have, as the market's risen toward the top of its range, been piling into bets that a selloff is in the offing. Tuesday the New York Stock Exchange reported that short interest on the Big Board rose above 8 million shares in the period ending April 15, or 2.3 percent of total shares on the exchange -- as high as it's ever been. This shows that even as the market rallied from its pre-war lows, bets that it would fall were mounting.
"People think the rally is completely over, said Bill Rhodes, chief investment strategist of Rhodes Analytics. "They're looking at it and saying, 'I want to sell it.'"
But shorting, where investors sell shares they have borrowed in the belief that they can buy them back at a lower price, can also be dangerous, because the potential for loss, if the stock you've shorted starts going higher, is unlimited.
So when shorts go wrong, short sellers are forced to buy the shares back that they've sold short. When this happens en masse, the result is a short squeeze, which can drive shares markedly higher. As the market runs up against the top of its trading range, such a squeeze is exactly what Rhodes expects to see. And although squeeze rallies often don't last long, because short interest is so high, Rhodes thinks this one could build up a decent head of steam.
"This rally could go on longer than people think and it could go farther than people think," he said. "We could really see some exciting action."

|

