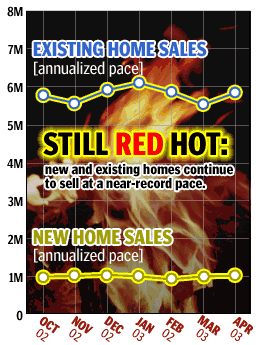
NEW YORK (CNN/Money) - The U.S. housing market, long a pillar of strength in an otherwise shaky economy, flexed its muscles again in April, according to separate reports from the government and the nation's realtors Tuesday.
The National Association of Realtors (NAR) said existing homes sold at an annual rate of 5.84 million units in April, 5.6 percent higher than March's 5.53-million-unit pace. Economists, on average, expected a pace of 5.67 million units, according to a Reuters poll.

"Favorable conditions in April caused existing-home sales to rise to their fifth-best showing ever -- a pace that will be difficult to sustain but demonstrates that the housing sector will be close to a record this year," NAR chief economist David Lereah said.
Separately, the Commerce Department said new homes sold at an annual rate of 1.028 million units in April, 1.7 percent higher than March's revised 1.011-million-unit pace. Economists, on average, expected a pace of 986,000 units, according to Reuters.
U.S. stock prices bounced back following the news, while Treasury bond prices were mostly higher.
| More on the housing boom
|

|
|
|
|
The housing market has been one of the few areas of strength in the U.S. economy, thanks mainly to interest rates at 40-year lows. Not only have low mortgage rates lured new homeowners, they've allowed people to refinance their existing mortgages at lower and lower rates.
Lower monthly mortgage payments have put more cash in homeowners' pockets, supporting consumer spending, which makes up more than two-thirds of the total economy. And many people have been able to turn some of their swelling home equity into cash, giving them even more money to spend.
Housing has been so strong, in fact, that more than a few analysts are worried the nation is in a home-price "bubble," similar to the bubble in stock prices in the late 1990s. Just as the Nasdaq bubble eventually burst, soaking investors, some economists fear a sudden drop in home prices that will hurt homeowners and the economy.
| TOOLS YOU CAN USE
|

|
|
|
|
Though some local markets might have seen home prices go too far, too fast, most analysts doubt the existence of a national bubble. Inventories on a national level have so far been well matched to demand, they say, meaning a sudden drop in demand for homes won't leave a glut of unsold houses on the market.
The inventory of new homes available for sale held steady at 338,000, representing 3.9 months' supply, the lowest level since September 2002, according to the Commerce Department.
But, more ominously, the NAR said the inventory of available, existing homes jumped 10.3 percent to 2.47 million, a 5.1-month supply at the current pace.
"There is an ever-growing number of homes on the market, and while the overhang is not great at the current selling pace, it could become a problem if we trend back toward more sustainable levels," said Joel Naroff, president and chief economist at Naroff Economic Advisors in Holland, Pa.
The median sales price for new houses was $185,100, according to the Commerce Department report, down from $185,400 in March. The median price for existing homes was $163,400, up from $163,100.

|

